
Uzbekistan vs Singapore carbon intensity of GDP (kg CO2 per $, PPP, 2021 prices)
1x
| Year | kg CO2 per $ | |
|---|---|---|
 Uzbekistan |
 Singapore |
|
| 2024 | 0.371 kg | 0.072 kg |
| 2023 | 0.354 kg | 0.073 kg |
| 2022 | 0.366 kg | 0.074 kg |
| 2021 | 0.404 kg | 0.076 kg |
| 2020 | 0.404 kg | 0.081 kg |
| 2019 | 0.381 kg | 0.081 kg |
| 2018 | 0.399 kg | 0.08 kg |
| 2017 | 0.442 kg | 0.086 kg |
| 2016 | 0.446 kg | 0.084 kg |
| 2015 | 0.449 kg | 0.091 kg |
| 2014 | 0.51 kg | 0.091 kg |
| 2013 | 0.589 kg | 0.093 kg |
| 2012 | 0.645 kg | 0.092 kg |
| 2011 | 0.78 kg | 0.099 kg |
| 2010 | 0.826 kg | 0.1 kg |
| 2009 | 0.814 kg | 0.103 kg |
| 2008 | 0.97 kg | 0.101 kg |
| 2007 | 1.013 kg | 0.104 kg |
| 2006 | 1.134 kg | 0.109 kg |
| 2005 | 1.138 kg | 0.119 kg |
| 2004 | 1.281 kg | 0.136 kg |
| 2003 | 1.343 kg | 0.142 kg |
| 2002 | 1.486 kg | 0.158 kg |
| 2001 | 1.497 kg | 0.167 kg |
| 2000 | 1.547 kg | 0.164 kg |
| 1999 | 1.517 kg | 0.163 kg |
| 1998 | 1.572 kg | 0.171 kg |
| 1997 | 1.435 kg | 0.171 kg |
| 1996 | 1.511 kg | 0.187 kg |
| 1995 | 1.491 kg | 0.196 kg |
| 1994 | 1.601 kg | 0.211 kg |
| 1993 | 1.592 kg | 0.222 kg |
| 1992 | 1.558 kg | 0.215 kg |
| 1991 | 1.484 kg | 0.224 kg |
| 1990 | 1.474 kg | 0.226 kg |
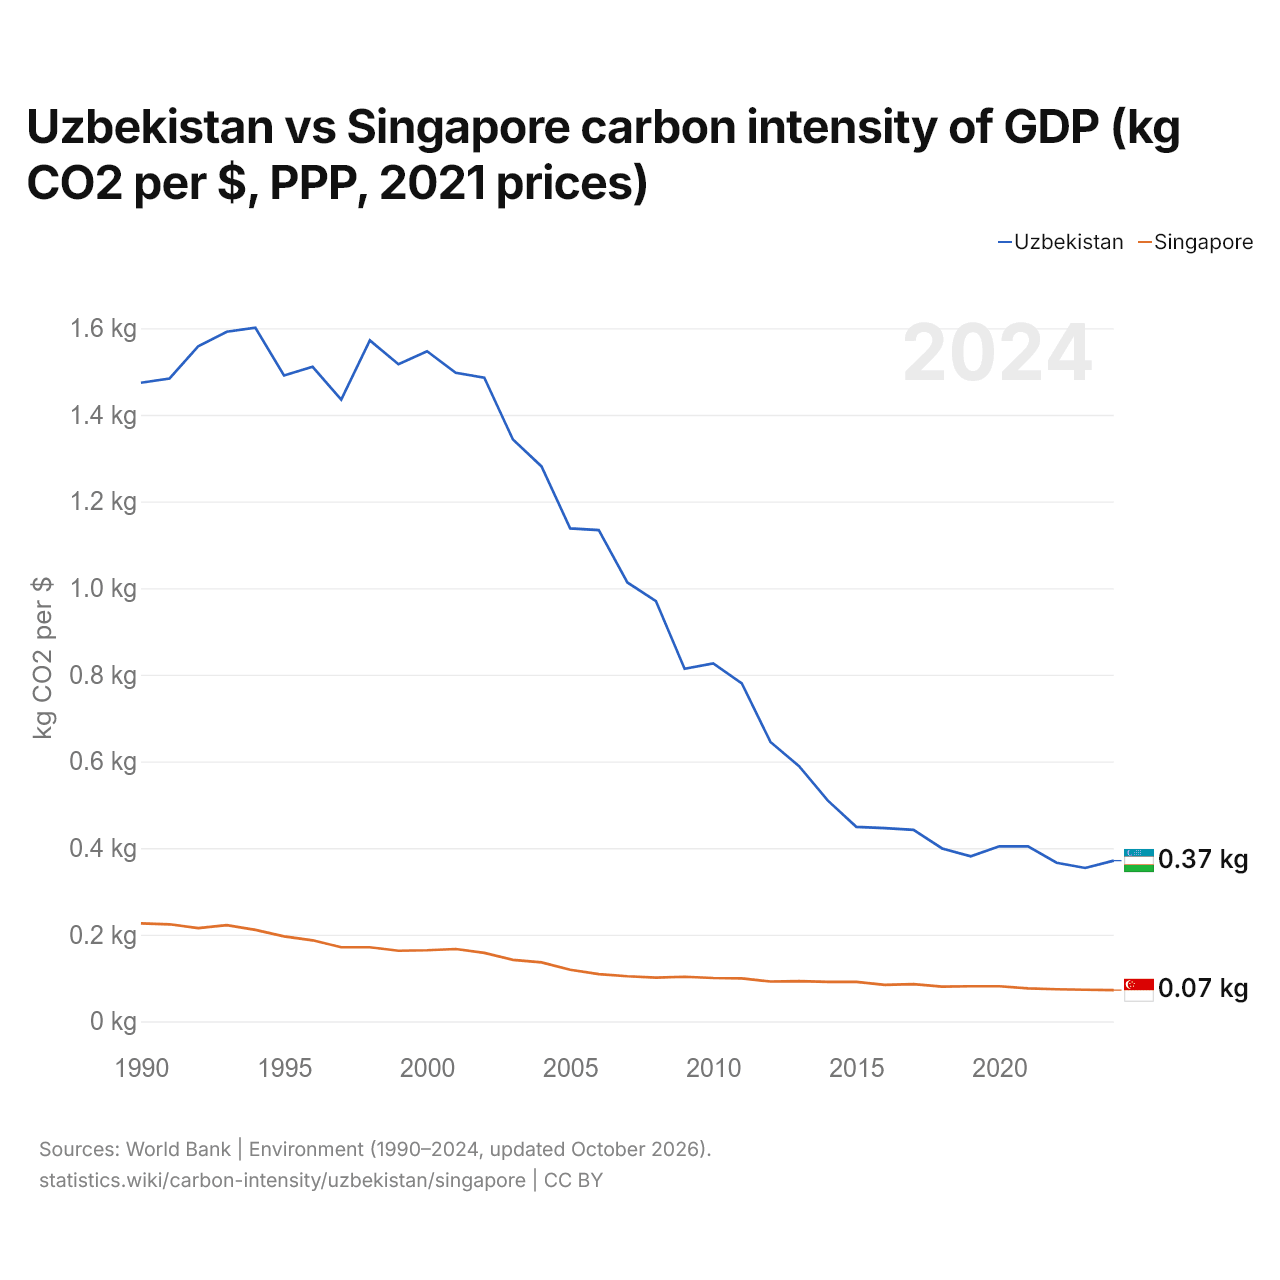
Carbon intensity is 0.371 kg of CO2 per dollar of GDP in Uzbekistan and 0.072 kg in Singapore: 0.299 kg more in Uzbekistan. In 1990, Uzbekistan emitted 1.474 kg and Singapore 0.226 kg, a difference of 1.248 kg.
Uzbekistan's carbon intensity has been higher than Singapore's every year since 1990. The gap was widest in 1998, when Uzbekistan's carbon intensity was 1.401 kg above Singapore's.
Uzbekistan vs Singapore: latest carbon intensity of GDP
|
Uzbekistan
|
Singapore
|
|
|---|---|---|
| kg CO2 per $ of GDP | 0.371 | 0.072 |
| World rank | 14/177 | 150/177 |
| Change since 1990 | −74.8% | −67.9% |
| Carbon intensity difference | 5.1× | 0.2× |
Compare the carbon intensity of GDP of any 2 countries
Sources:
- World Bank | Environment (1990–2024, updated October 2026)
Creative Commons Attribution (CC BY): you may copy, share, adapt and reuse this content, also commercially, as long as you credit statistics.wiki and note any changes you made. The sources listed above may have their own license terms.