
United Kingdom vs Lithuania carbon intensity of GDP (kg CO2 per $, PPP, 2021 prices)
1x
| Year | kg CO2 per $ | |
|---|---|---|
 United Kingdom |
 Lithuania |
|
| 2024 | 0.079 kg | 0.095 kg |
| 2023 | 0.083 kg | 0.098 kg |
| 2022 | 0.089 kg | 0.1 kg |
| 2021 | 0.097 kg | 0.111 kg |
| 2020 | 0.1 kg | 0.118 kg |
| 2019 | 0.101 kg | 0.118 kg |
| 2018 | 0.106 kg | 0.121 kg |
| 2017 | 0.11 kg | 0.127 kg |
| 2016 | 0.117 kg | 0.128 kg |
| 2015 | 0.127 kg | 0.133 kg |
| 2014 | 0.134 kg | 0.132 kg |
| 2013 | 0.151 kg | 0.139 kg |
| 2012 | 0.157 kg | 0.157 kg |
| 2011 | 0.152 kg | 0.162 kg |
| 2010 | 0.167 kg | 0.169 kg |
| 2009 | 0.165 kg | 0.159 kg |
| 2008 | 0.174 kg | 0.163 kg |
| 2007 | 0.179 kg | 0.164 kg |
| 2006 | 0.188 kg | 0.166 kg |
| 2005 | 0.192 kg | 0.175 kg |
| 2004 | 0.198 kg | 0.177 kg |
| 2003 | 0.202 kg | 0.18 kg |
| 2002 | 0.204 kg | 0.199 kg |
| 2001 | 0.213 kg | 0.211 kg |
| 2000 | 0.214 kg | 0.211 kg |
| 1999 | 0.22 kg | 0.25 kg |
| 1998 | 0.228 kg | 0.295 kg |
| 1997 | 0.235 kg | 0.3 kg |
| 1996 | 0.256 kg | 0.336 kg |
| 1995 | 0.254 kg | 0.342 kg |
| 1994 | 0.266 kg | 0.368 kg |
| 1993 | 0.283 kg | 0.342 kg |
| 1992 | 0.301 kg | 0.369 kg |
| 1991 | 0.312 kg | 0.515 kg |
| 1990 | 0.304 kg | 0.461 kg |
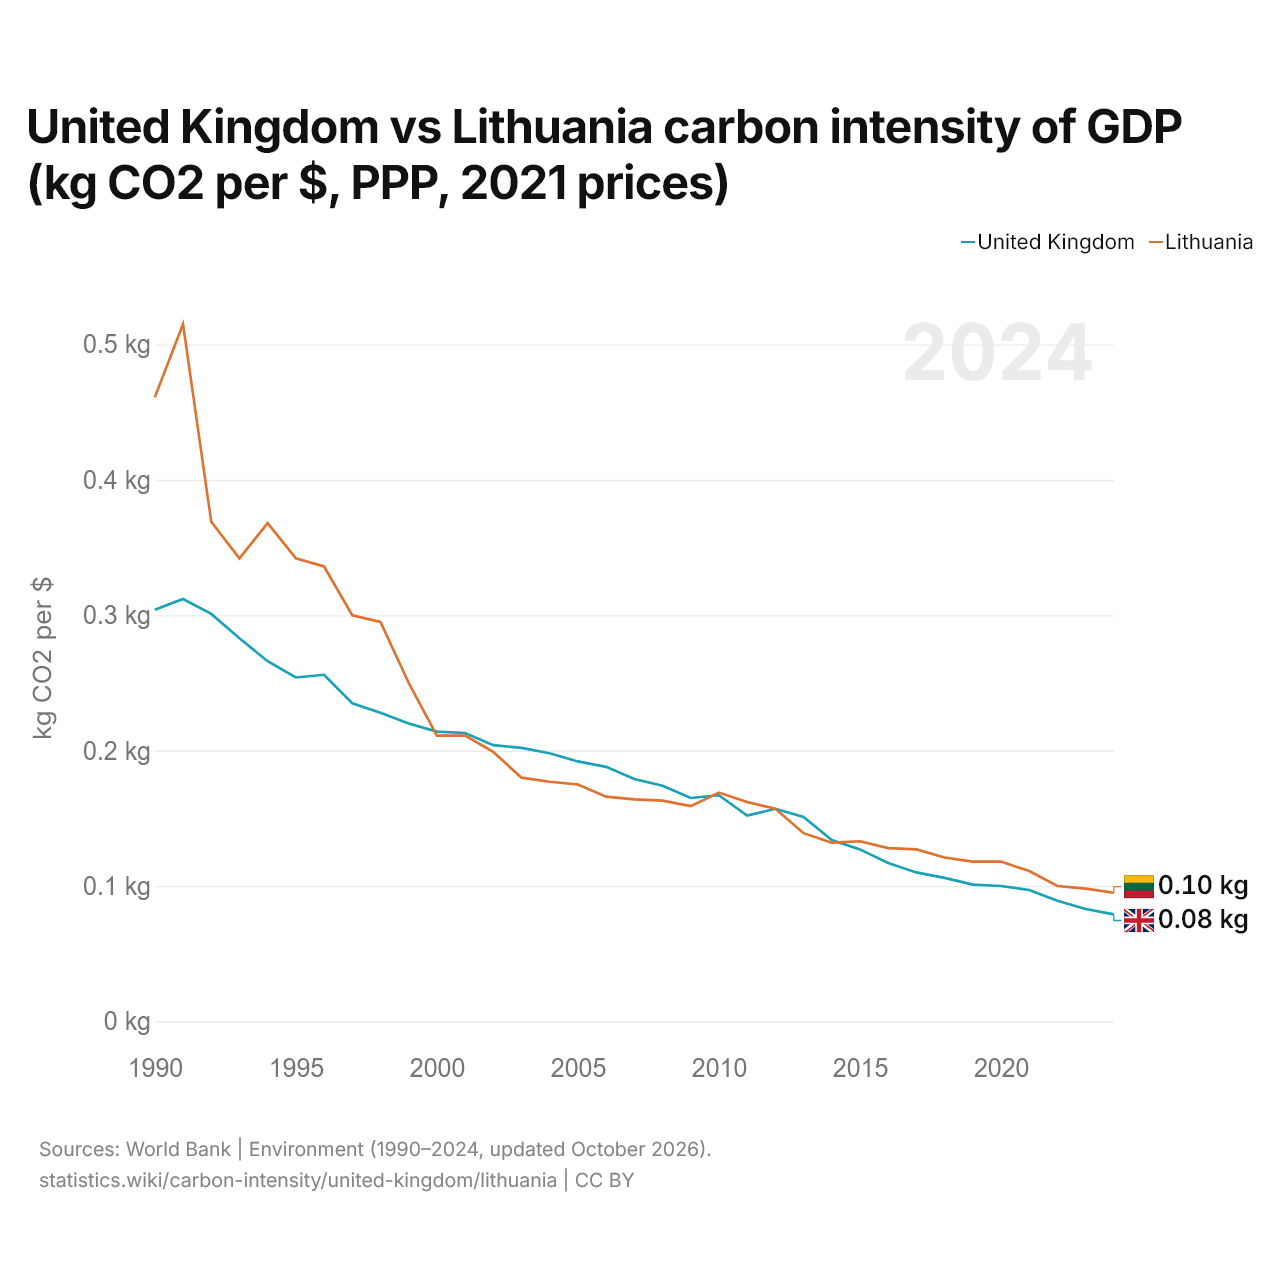
Carbon intensity is 0.079 kg of CO2 per dollar of GDP in the United Kingdom and 0.095 kg in Lithuania: 0.016 kg more in Lithuania. In 1990, the United Kingdom emitted 0.304 kg and Lithuania 0.461 kg, a difference of 0.157 kg.
Lithuania's carbon intensity has been higher than the United Kingdom's every year since 2015. The gap was widest in 1991, when Lithuania's carbon intensity was 0.203 kg above the United Kingdom's.
United Kingdom vs Lithuania: latest carbon intensity of GDP
|
United Kingdom
|
Lithuania
|
|
|---|---|---|
| kg CO2 per $ of GDP | 0.079 | 0.095 |
| World rank | 143/177 | 124/177 |
| Change since 1990 | −74.0% | −79.5% |
| Carbon intensity difference | 0.84× | 1.2× |
Compare the carbon intensity of GDP of any 2 countries
Sources:
- World Bank | Environment (1990–2024, updated October 2026)
Creative Commons Attribution (CC BY): you may copy, share, adapt and reuse this content, also commercially, as long as you credit statistics.wiki and note any changes you made. The sources listed above may have their own license terms.