
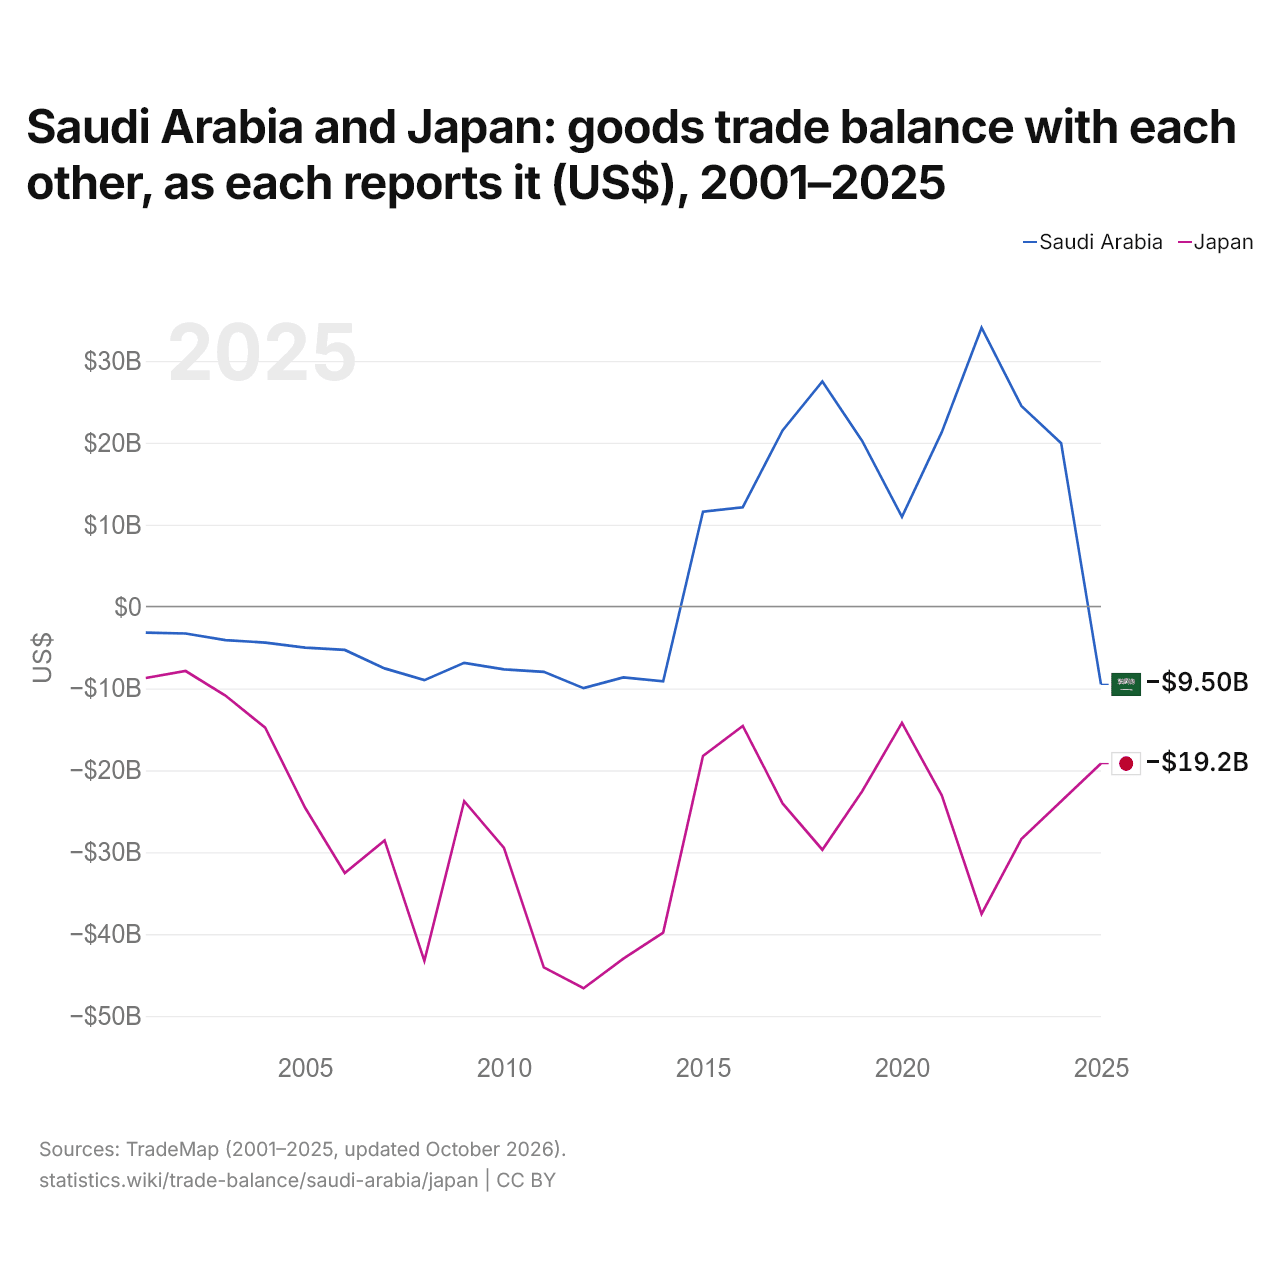
A Arábia Saudita e o Japão: saldo do comércio de bens entre os dois, segundo cada um (US$), 2001–2025
| Ano | US$ | |
|---|---|---|
| Arábia Saudita | Japão | |
| 2025 | US$ −9.504.001.000 | US$ −19.181.844.000 |
| 2024 | US$ 19.945.746.000 | US$ −23.787.487.000 |
| 2023 | US$ 24.494.288.000 | US$ −28.403.941.000 |
| 2022 | US$ 34.051.967.000 | US$ −37.542.509.000 |
| 2021 | US$ 21.297.604.000 | US$ −23.067.243.000 |
| 2020 | US$ 10.952.907.000 | US$ −14.211.867.000 |
| 2019 | US$ 20.218.075.000 | US$ −22.557.634.000 |
| 2018 | US$ 27.481.650.000 | US$ −29.700.998.000 |
| 2017 | US$ 21.505.492.000 | US$ −24.038.372.000 |
| 2016 | US$ 12.129.828.000 | US$ −14.571.681.000 |
| 2015 | US$ 11.588.611.000 | US$ −18.252.079.000 |
| 2014 | US$ −9.124.725.000 | US$ −39.813.496.000 |
| 2013 | US$ −8.658.870.000 | US$ −43.008.854.000 |
| 2012 | US$ −9.966.157.000 | US$ −46.621.770.000 |
| 2011 | US$ −7.979.472.000 | US$ −44.062.210.000 |
| 2010 | US$ −7.671.164.000 | US$ −29.485.706.000 |
| 2009 | US$ −6.877.822.000 | US$ −23.766.303.000 |
| 2008 | US$ −8.989.019.000 | US$ −43.266.033.000 |
| 2007 | US$ −7.553.517.000 | US$ −28.558.749.000 |
| 2006 | US$ −5.299.247.000 | US$ −32.549.021.000 |
| 2005 | US$ −5.008.544.000 | US$ −24.547.525.000 |
| 2004 | US$ −4.402.274.000 | US$ −14.785.145.000 |
| 2003 | US$ −4.106.413.000 | US$ −10.869.800.000 |
| 2002 | US$ −3.288.443.000 | US$ −7.872.969.000 |
| 2001 | US$ −3.183.535.000 | US$ −8.722.169.000 |
Em 2025, segundo a Arábia Saudita, o seu comércio de bens com o Japão teve um déficit de US$ 9,5 bilhões; segundo o Japão, o seu comércio de bens com a Arábia Saudita teve um déficit de US$ 19,2 bilhões. Em 2001, os valores foram um déficit de US$ 3,18 bilhões da Arábia Saudita e um déficit de US$ 8,72 bilhões do Japão.
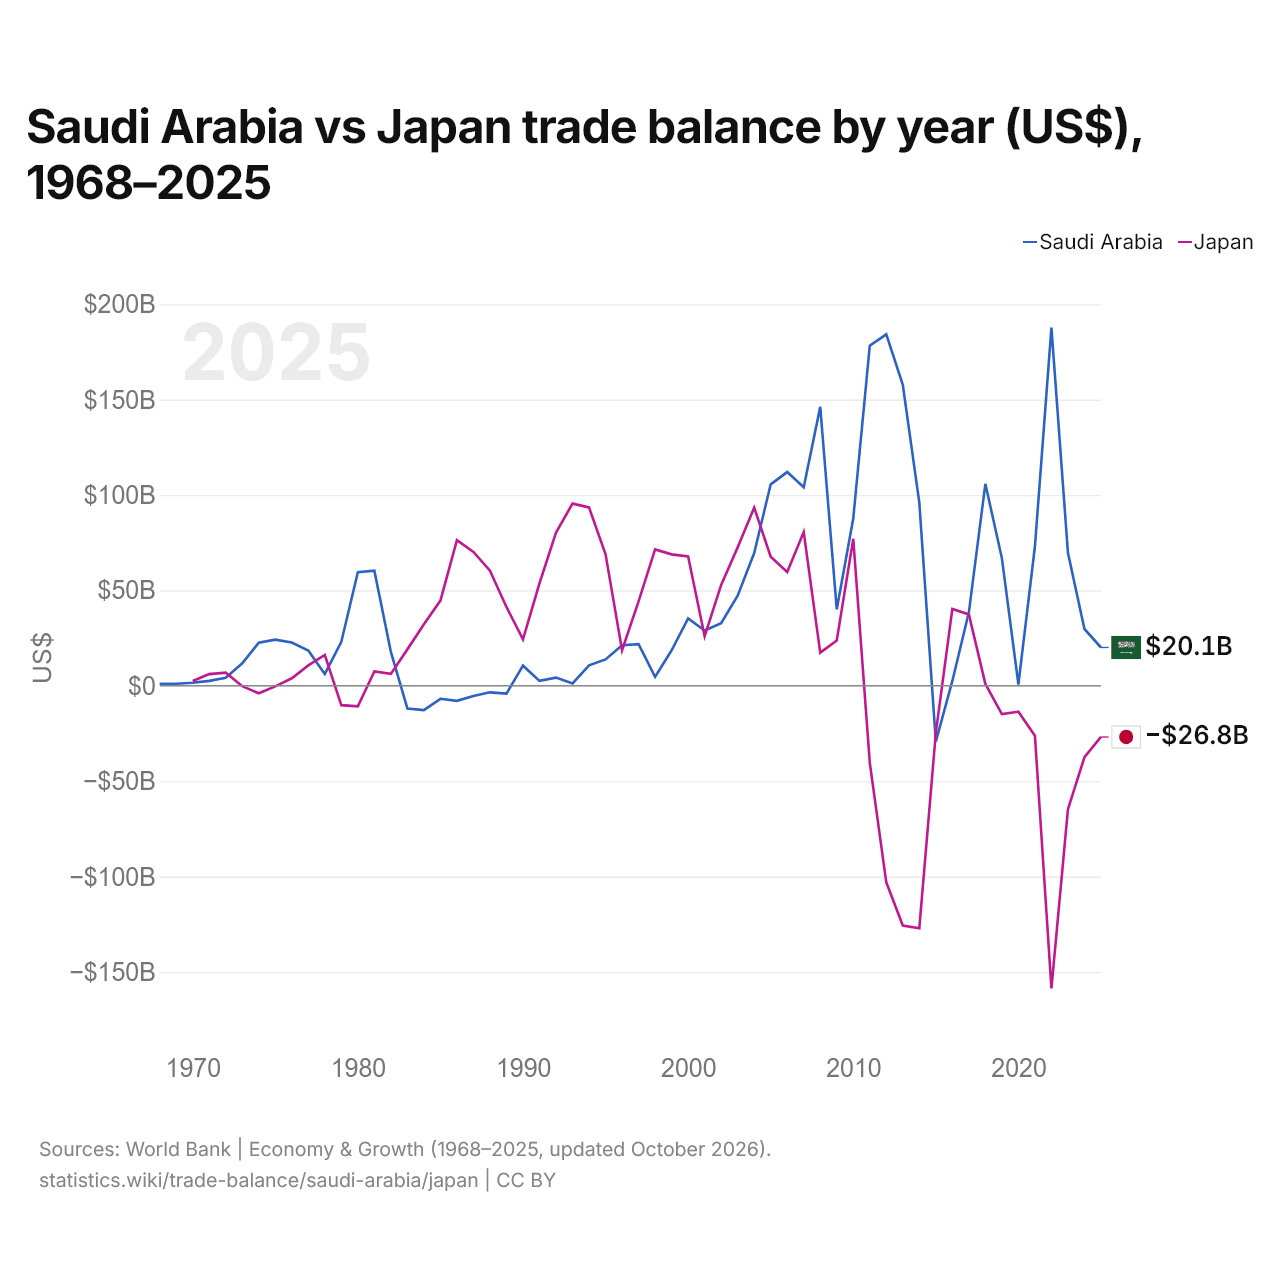
Arábia Saudita vs Japão: balança comercial por ano (US$), 1968–2025
| Ano | US$ | |
|---|---|---|
 Arábia Saudita |
 Japão |
|
| 2025 | US$ 20.067.466.667 | US$ −26.840.701.298 |
| 2024 | US$ 29.736.533.333 | US$ −37.421.806.079 |
| 2023 | US$ 69.635.466.667 | US$ −64.740.755.791 |
| 2022 | US$ 187.668.533.333 | US$ −158.565.740.395 |
| 2021 | US$ 72.986.133.333 | US$ −26.203.979.027 |
| 2020 | US$ 664.000.000 | US$ −13.587.503.404 |
| 2019 | US$ 66.885.333.333 | US$ −14.829.877.577 |
| 2018 | US$ 105.847.466.667 | US$ 964.471.415 |
| 2017 | US$ 38.494.666.667 | US$ 37.424.841.039 |
| 2016 | US$ 2.512.533.333 | US$ 40.295.828.111 |
| 2015 | US$ −29.296.800.000 | US$ −24.640.621.321 |
| 2014 | US$ 95.966.400.000 | US$ −127.067.136.943 |
| 2013 | US$ 157.750.133.333 | US$ −125.688.992.897 |
| 2012 | US$ 184.213.333.333 | US$ −103.017.334.054 |
| 2011 | US$ 178.246.400.000 | US$ −40.334.797.700 |
| 2010 | US$ 87.628.266.667 | US$ 77.030.184.880 |
| 2009 | US$ 39.987.200.000 | US$ 23.690.260.030 |
| 2008 | US$ 146.168.800.000 | US$ 17.356.895.109 |
| 2007 | US$ 104.039.226.151 | US$ 80.582.742.763 |
| 2006 | US$ 112.011.748.999 | US$ 59.659.000.527 |
| 2005 | US$ 105.591.257.239 | US$ 67.663.961.124 |
| 2004 | US$ 69.570.133.333 | US$ 93.354.468.404 |
| 2003 | US$ 47.212.533.333 | US$ 72.560.562.736 |
| 2002 | US$ 32.810.933.333 | US$ 52.861.517.849 |
| 2001 | US$ 28.922.133.333 | US$ 25.985.588.613 |
| 2000 | US$ 35.333.333.333 | US$ 67.799.063.708 |
| 1999 | US$ 18.576.266.667 | US$ 68.865.072.147 |
| 1998 | US$ 4.662.133.333 | US$ 71.492.903.649 |
| 1997 | US$ 21.789.586.115 | US$ 44.200.018.348 |
| 1996 | US$ 21.247.797.063 | US$ 18.591.806.698 |
| 1995 | US$ 13.809.612.817 | US$ 68.922.257.802 |
| 1994 | US$ 10.720.160.214 | US$ 93.444.922.990 |
| 1993 | US$ 1.194.926.569 | US$ 95.479.406.967 |
| 1992 | US$ 4.279.305.741 | US$ 80.350.537.263 |
| 1991 | US$ 2.535.380.507 | US$ 53.732.293.939 |
| 1990 | US$ 10.541.522.029 | US$ 24.355.543.277 |
| 1989 | US$ −4.130.040.053 | US$ 41.293.261.160 |
| 1988 | US$ −3.423.497.997 | US$ 60.323.819.348 |
| 1987 | US$ −5.373.831.776 | US$ 70.124.276.208 |
| 1986 | US$ −7.899.000.810 | US$ 76.375.001.632 |
| 1985 | US$ −6.827.443.401 | US$ 44.629.778.842 |
| 1984 | US$ −12.800.510.783 | US$ 32.246.208.254 |
| 1983 | US$ −11.894.066.570 | US$ 19.079.902.169 |
| 1982 | US$ 17.796.370.134 | US$ 6.219.770.858 |
| 1981 | US$ 60.310.278.645 | US$ 7.475.883.734 |
| 1980 | US$ 59.490.035.596 | US$ −10.762.068.406 |
| 1979 | US$ 23.056.756.397 | US$ −10.178.503.568 |
| 1978 | US$ 6.195.798.165 | US$ 16.145.734.415 |
| 1977 | US$ 18.443.064.170 | US$ 10.673.368.053 |
| 1976 | US$ 22.707.932.011 | US$ 3.911.996.800 |
| 1975 | US$ 24.135.407.771 | US$ −316.462.115 |
| 1974 | US$ 22.585.633.803 | US$ −3.967.665.540 |
| 1973 | US$ 11.776.865.468 | US$ −231.313.286 |
| 1972 | US$ 4.185.774.158 | US$ 6.834.642.809 |
| 1971 | US$ 2.591.362.408 | US$ 6.099.709.614 |
| 1970 | US$ 1.572.222.222 | US$ 2.454.150.061 |
| 1969 | US$ 1.042.836.022 | - |
| 1968 | US$ 963.960.711 | - |
Em 2025, a balança comercial da Arábia Saudita teve um superávit de US$ 20,1 bilhões e a do Japão, um déficit de US$ 26,8 bilhões. Em 1970, a balança comercial da Arábia Saudita teve um superávit de US$ 1,57 bilhão e a do Japão, um superávit de US$ 2,45 bilhões.
De 1970 a 2025, a balança comercial da Arábia Saudita teve superávit em 48 dos 56 anos, e a do Japão, em 39. As balanças comerciais da Arábia Saudita e do Japão tiveram déficit ao mesmo tempo em apenas um desses anos, 2015.
Arábia Saudita vs Japão: dados da balança comercial
|
Arábia Saudita
|
Japão
|
|
|---|---|---|
| Bens e serviços, US$ | +US$ 20,1 bi (2025) | -US$ 26,8 bi (2025) |
| % do PIB | +1,6% (2025) | −0,6% (2025) |
| Anos com superávit desde 2000 | 25 de 26 | 14 de 26 |
| Saldo de bens entre os dois, dados próprios | -US$ 9,50 bi (2025) | -US$ 19,2 bi (2025) |
| Maior superávit em bens com | Emirados Árabes Unidos (+US$ 14,2 bi, 2025) | Estados Unidos (+US$ 49,5 bi, 2025) |
| Maior déficit em bens com | China (-US$ 61,7 bi, 2025) | China (-US$ 53,0 bi, 2025) |
Comparar a balança comercial de 2 países quaisquer
Fontes:
- Banco Mundial | Economy & Growth (1968–2025, atualizado em outubro de 2026)
- TradeMap (2001–2025, atualizado em outubro de 2026)
Creative Commons Atribuição (CC BY): você pode copiar, compartilhar, adaptar e reutilizar este conteúdo, inclusive para fins comerciais, desde que cite o statistics.wiki e indique as alterações que fizer. As fontes listadas acima podem ter suas próprias condições de licença.