
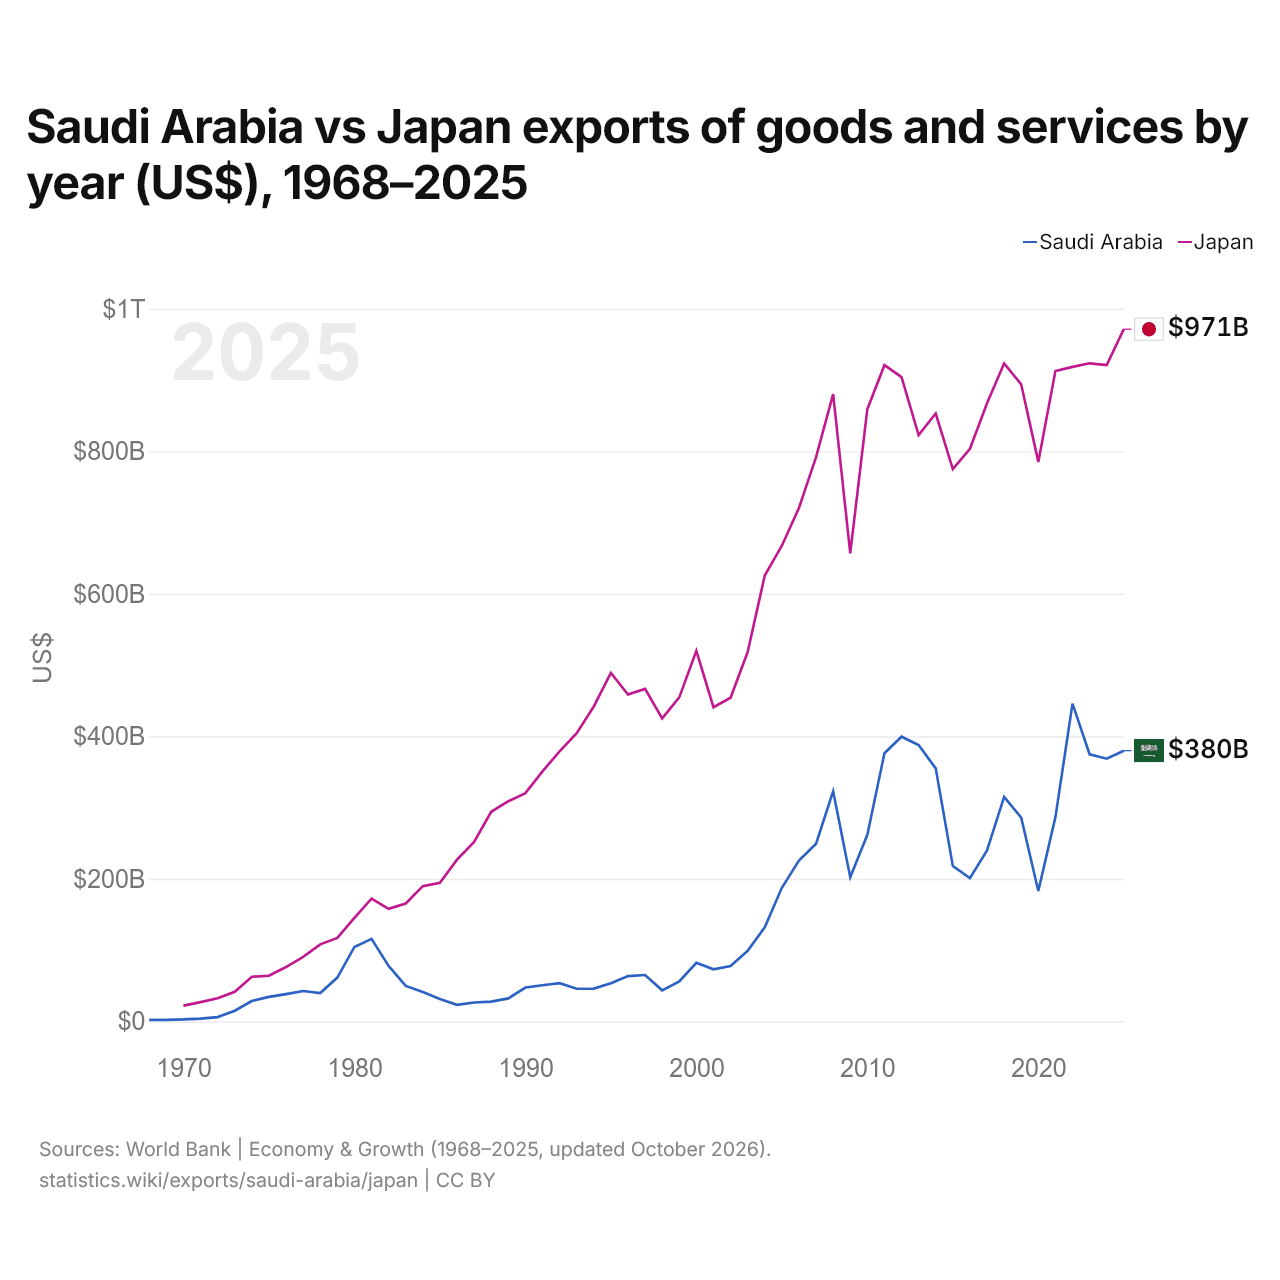
Arábia Saudita vs Japão: exportações de bens e serviços por ano (US$), 1968–2025
| Ano | US$ | |
|---|---|---|
 Arábia Saudita |
 Japão |
|
| 2025 | US$ 379.825.066.667 | US$ 971.285.188.334 |
| 2024 | US$ 368.566.933.333 | US$ 920.960.002.390 |
| 2023 | US$ 374.787.466.667 | US$ 923.420.059.651 |
| 2022 | US$ 445.881.333.333 | US$ 918.412.226.914 |
| 2021 | US$ 286.501.333.333 | US$ 912.551.747.360 |
| 2020 | US$ 182.847.733.333 | US$ 785.057.625.362 |
| 2019 | US$ 285.860.000.000 | US$ 893.761.110.034 |
| 2018 | US$ 314.916.533.333 | US$ 923.192.943.803 |
| 2017 | US$ 239.892.533.333 | US$ 867.373.157.903 |
| 2016 | US$ 200.877.333.333 | US$ 803.470.630.550 |
| 2015 | US$ 218.010.400.000 | US$ 775.031.229.091 |
| 2014 | US$ 354.973.333.333 | US$ 852.957.541.825 |
| 2013 | US$ 387.745.333.333 | US$ 822.673.891.615 |
| 2012 | US$ 399.419.466.667 | US$ 904.081.818.095 |
| 2011 | US$ 376.224.000.000 | US$ 920.847.566.474 |
| 2010 | US$ 261.830.933.333 | US$ 859.110.359.863 |
| 2009 | US$ 202.056.266.667 | US$ 656.874.364.781 |
| 2008 | US$ 322.853.600.000 | US$ 880.075.851.760 |
| 2007 | US$ 249.318.478.986 | US$ 791.701.308.241 |
| 2006 | US$ 225.506.542.056 | US$ 720.411.902.737 |
| 2005 | US$ 187.388.647.221 | US$ 667.445.122.493 |
| 2004 | US$ 131.920.533.333 | US$ 625.631.972.494 |
| 2003 | US$ 98.956.800.000 | US$ 518.203.970.380 |
| 2002 | US$ 77.641.333.333 | US$ 454.066.577.344 |
| 2001 | US$ 72.980.533.333 | US$ 440.830.946.384 |
| 2000 | US$ 82.259.466.667 | US$ 519.863.963.885 |
| 1999 | US$ 56.061.600.000 | US$ 454.583.045.086 |
| 1998 | US$ 43.493.066.667 | US$ 425.156.200.704 |
| 1997 | US$ 64.989.052.069 | US$ 466.482.189.983 |
| 1996 | US$ 63.501.201.602 | US$ 458.650.604.758 |
| 1995 | US$ 53.521.228.304 | US$ 488.922.980.748 |
| 1994 | US$ 45.960.747.664 | US$ 441.885.061.610 |
| 1993 | US$ 45.678.237.650 | US$ 404.418.972.318 |
| 1992 | US$ 53.610.680.908 | US$ 378.894.650.114 |
| 1991 | US$ 50.652.603.471 | US$ 350.804.377.214 |
| 1990 | US$ 47.445.927.904 | US$ 320.186.473.747 |
| 1989 | US$ 32.174.632.844 | US$ 308.916.648.063 |
| 1988 | US$ 27.645.126.836 | US$ 294.106.125.787 |
| 1987 | US$ 26.447.263.017 | US$ 251.700.285.196 |
| 1986 | US$ 23.221.442.074 | US$ 226.865.329.771 |
| 1985 | US$ 31.243.235.781 | US$ 194.351.120.461 |
| 1984 | US$ 41.296.821.793 | US$ 189.758.022.924 |
| 1983 | US$ 49.690.593.343 | US$ 165.329.539.555 |
| 1982 | US$ 77.741.454.554 | US$ 157.933.279.187 |
| 1981 | US$ 115.769.423.162 | US$ 172.134.410.830 |
| 1980 | US$ 104.409.960.255 | US$ 145.104.895.105 |
| 1979 | US$ 61.361.500.126 | US$ 116.997.148.836 |
| 1978 | US$ 39.584.805.337 | US$ 108.052.061.241 |
| 1977 | US$ 42.599.781.848 | US$ 90.568.192.250 |
| 1976 | US$ 38.230.311.615 | US$ 76.182.443.149 |
| 1975 | US$ 34.300.542.527 | US$ 63.986.133.887 |
| 1974 | US$ 28.581.126.761 | US$ 62.536.307.379 |
| 1973 | US$ 14.903.189.968 | US$ 41.576.284.285 |
| 1972 | US$ 5.951.621.243 | US$ 32.270.972.031 |
| 1971 | US$ 3.878.685.816 | US$ 26.966.713.726 |
| 1970 | US$ 2.731.777.778 | US$ 22.026.785.842 |
| 1969 | US$ 2.161.704.511 | - |
| 1968 | US$ 1.998.980.667 | - |
Em 2025, as exportações de bens e serviços da Arábia Saudita foram de US$ 380 bilhões e as do Japão, de US$ 971 bilhões: as do Japão foram 2,6 vezes maiores. Em 1970, as exportações do Japão foram 8,1 vezes maiores: US$ 2,73 bilhões da Arábia Saudita e US$ 22 bilhões do Japão.
As exportações de bens e serviços do Japão têm sido maiores que as da Arábia Saudita todos os anos desde 1970.
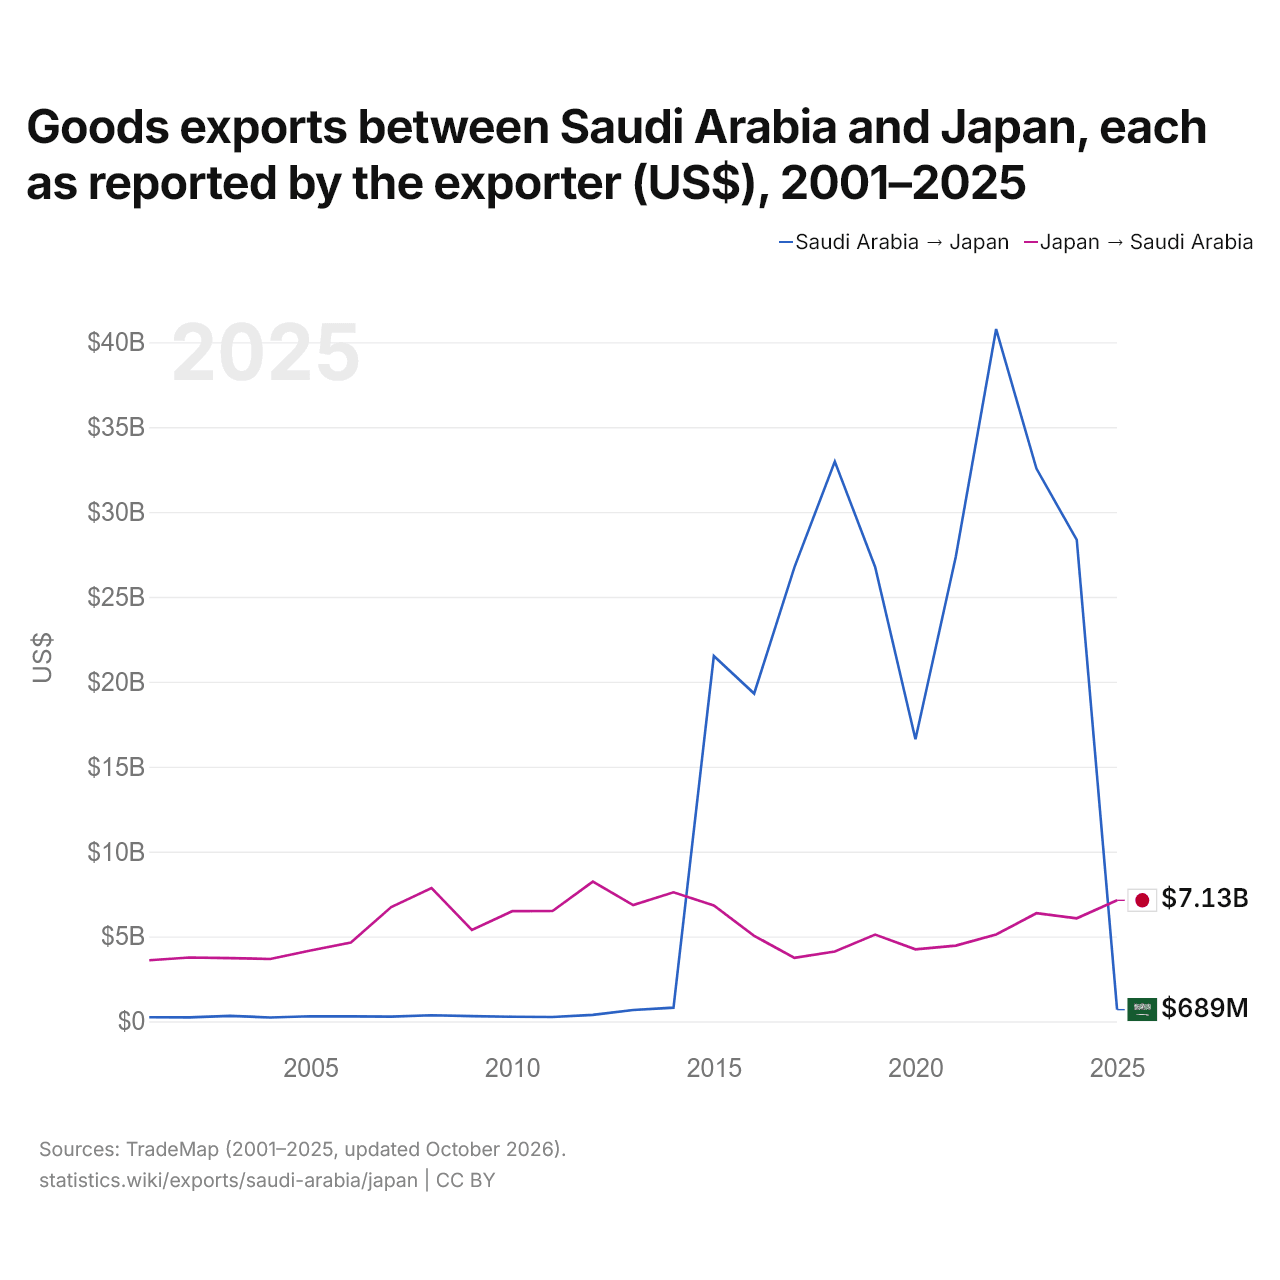
Exportações de bens entre a Arábia Saudita e o Japão, segundo o exportador (US$), 2001–2025
| Ano | US$ | |
|---|---|---|
| Arábia [...] → Japão | Japão → Arábia [...] | |
| 2025 | US$ 689.219.000 | US$ 7.128.754.000 |
| 2024 | US$ 28.353.030.000 | US$ 6.067.670.000 |
| 2023 | US$ 32.556.160.000 | US$ 6.368.630.000 |
| 2022 | US$ 40.770.707.000 | US$ 5.115.079.000 |
| 2021 | US$ 27.359.569.000 | US$ 4.457.161.000 |
| 2020 | US$ 16.614.446.000 | US$ 4.240.698.000 |
| 2019 | US$ 26.763.868.000 | US$ 5.107.984.000 |
| 2018 | US$ 32.972.225.000 | US$ 4.113.639.000 |
| 2017 | US$ 26.751.019.000 | US$ 3.735.333.000 |
| 2016 | US$ 19.305.959.000 | US$ 5.035.586.000 |
| 2015 | US$ 21.514.519.000 | US$ 6.828.410.000 |
| 2014 | US$ 806.757.000 | US$ 7.600.955.000 |
| 2013 | US$ 666.988.000 | US$ 6.847.345.000 |
| 2012 | US$ 383.596.000 | US$ 8.228.300.000 |
| 2011 | US$ 256.628.000 | US$ 6.495.947.000 |
| 2010 | US$ 268.416.000 | US$ 6.486.304.000 |
| 2009 | US$ 309.102.000 | US$ 5.384.681.000 |
| 2008 | US$ 357.527.000 | US$ 7.850.441.000 |
| 2007 | US$ 281.850.000 | US$ 6.728.216.000 |
| 2006 | US$ 294.788.000 | US$ 4.642.475.000 |
| 2005 | US$ 299.689.000 | US$ 4.174.424.000 |
| 2004 | US$ 225.485.000 | US$ 3.673.578.000 |
| 2003 | US$ 319.215.000 | US$ 3.726.937.000 |
| 2002 | US$ 230.391.000 | US$ 3.758.081.000 |
| 2001 | US$ 238.956.000 | US$ 3.599.852.000 |
Em 2025, as exportações de bens da Arábia Saudita para o Japão, segundo a Arábia Saudita, foram de US$ 689 milhões, e as do Japão para a Arábia Saudita, segundo o Japão, de US$ 7,13 bilhões: 10 vezes mais do Japão. Em 2001, foram de US$ 239 milhões da Arábia Saudita e de US$ 3,6 bilhões do Japão.
Arábia Saudita vs Japão: dados de exportações
|
Arábia Saudita
|
Japão
|
|
|---|---|---|
| Exportações | US$ 380 bi (2025) | US$ 971 bi (2025) |
| Posição mundial | 27/176 | 9/176 |
| Participação mundial | 1,09% | 2,78% |
| % do PIB | 29,7% | 21,9% |
| Maior categoria de bens | Petróleo, gás, minérios e outras matérias-primas (72,3%, 2025) | Máquinas, eletrônicos e veículos (59,1%, 2025) |
| Principal destino dos bens | Emirados Árabes Unidos (9,19%, 2025) | Estados Unidos (18,6%, 2025) |
Comparar as exportações de 2 países quaisquer
Fontes:
- Banco Mundial | Economy & Growth (1968–2025, atualizado em outubro de 2026)
- TradeMap (2001–2025, atualizado em outubro de 2026)
Creative Commons Atribuição (CC BY): você pode copiar, compartilhar, adaptar e reutilizar este conteúdo, inclusive para fins comerciais, desde que cite o statistics.wiki e indique as alterações que fizer. As fontes listadas acima podem ter suas próprias condições de licença.