
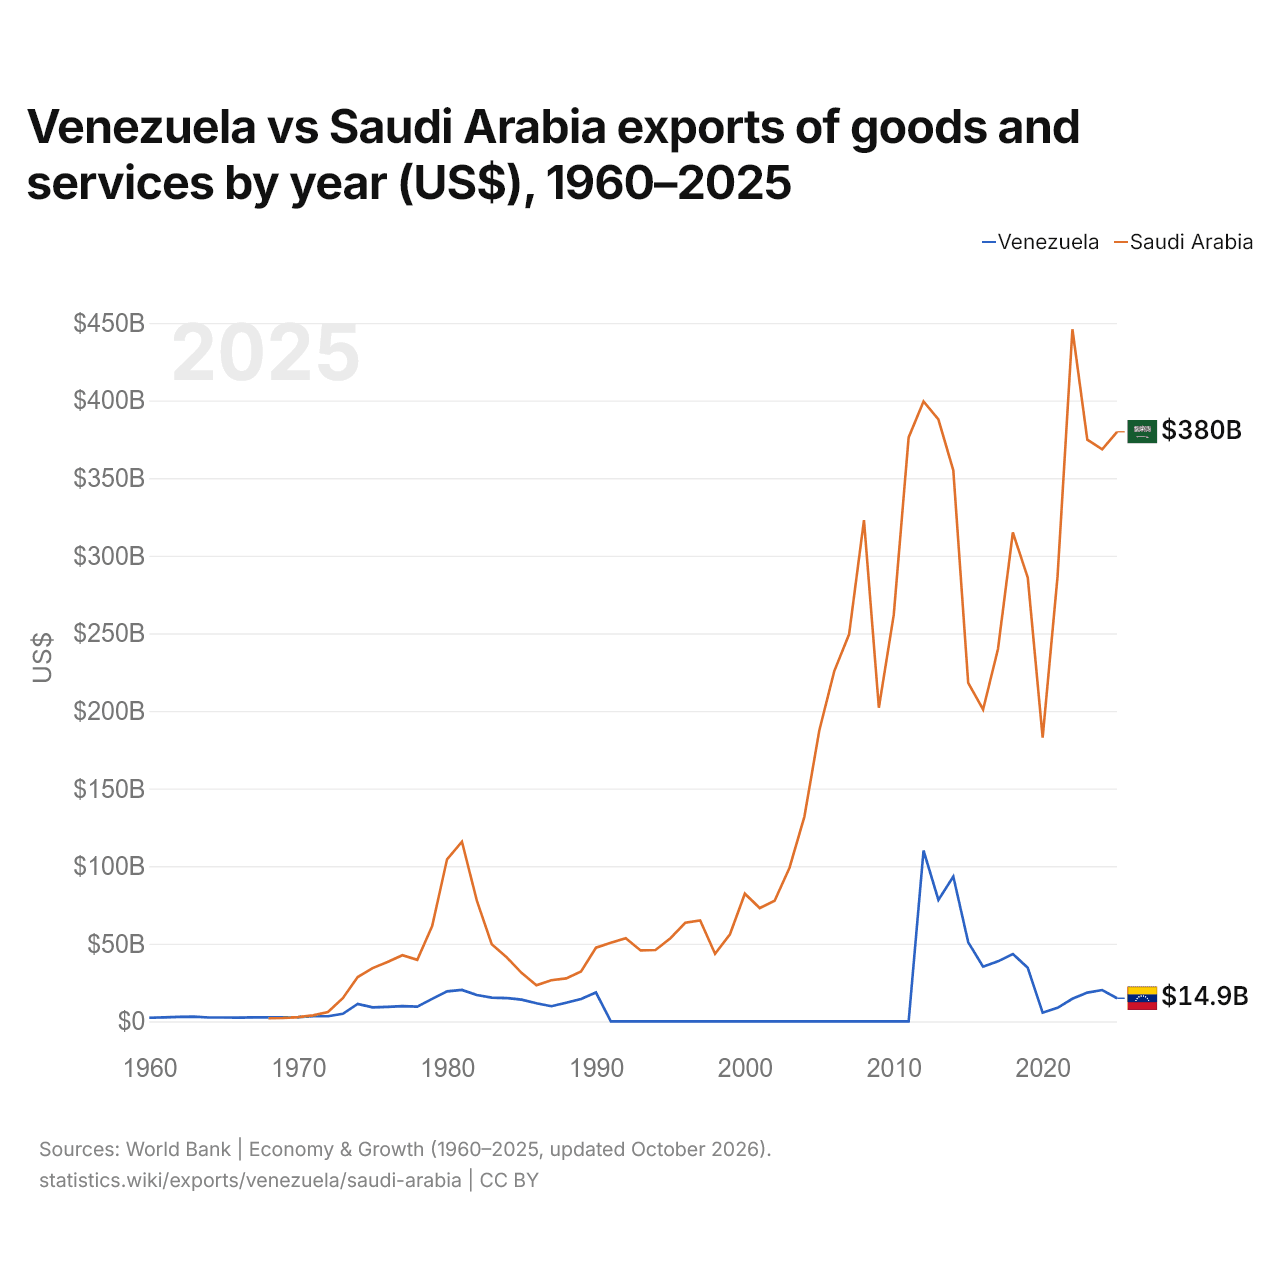
Venezuela vs Arábia Saudita: exportações de bens e serviços por ano (US$), 1960–2025
| Ano | US$ | |
|---|---|---|
 Venezuela |
 Arábia Saudita |
|
| 2025 | US$ 14.852.682.003 | US$ 379.825.066.667 |
| 2024 | US$ 20.176.779.559 | US$ 368.566.933.333 |
| 2023 | US$ 18.495.894.770 | US$ 374.787.466.667 |
| 2022 | US$ 14.552.860.356 | US$ 445.881.333.333 |
| 2021 | US$ 8.690.436.504 | US$ 286.501.333.333 |
| 2020 | US$ 5.571.267.854 | US$ 182.847.733.333 |
| 2019 | US$ 34.459.561.493 | US$ 285.860.000.000 |
| 2018 | US$ 43.392.568.659 | US$ 314.916.533.333 |
| 2017 | US$ 38.630.825.248 | US$ 239.892.533.333 |
| 2016 | US$ 35.237.270.127 | US$ 200.877.333.333 |
| 2015 | US$ 51.045.259.321 | US$ 218.010.400.000 |
| 2014 | US$ 93.349.895.633 | US$ 354.973.333.333 |
| 2013 | US$ 78.189.405.110 | US$ 387.745.333.333 |
| 2012 | US$ 110.049.401.395 | US$ 399.419.466.667 |
| 2011 | US$ 0 | US$ 376.224.000.000 |
| 2010 | US$ 0 | US$ 261.830.933.333 |
| 2009 | US$ 0 | US$ 202.056.266.667 |
| 2008 | US$ 0 | US$ 322.853.600.000 |
| 2007 | US$ 0 | US$ 249.318.478.986 |
| 2006 | US$ 0 | US$ 225.506.542.056 |
| 2005 | US$ 0 | US$ 187.388.647.221 |
| 2004 | US$ 0 | US$ 131.920.533.333 |
| 2003 | US$ 0 | US$ 98.956.800.000 |
| 2002 | US$ 0 | US$ 77.641.333.333 |
| 2001 | US$ 0 | US$ 72.980.533.333 |
| 2000 | US$ 0 | US$ 82.259.466.667 |
| 1999 | US$ 0 | US$ 56.061.600.000 |
| 1998 | US$ 0 | US$ 43.493.066.667 |
| 1997 | US$ 0 | US$ 64.989.052.069 |
| 1996 | US$ 0 | US$ 63.501.201.602 |
| 1995 | US$ 0 | US$ 53.521.228.304 |
| 1994 | US$ 0 | US$ 45.960.747.664 |
| 1993 | US$ 0 | US$ 45.678.237.650 |
| 1992 | US$ 0 | US$ 53.610.680.908 |
| 1991 | US$ 0 | US$ 50.652.603.471 |
| 1990 | US$ 18.555.857.828 | US$ 47.445.927.904 |
| 1989 | US$ 14.376.184.482 | US$ 32.174.632.844 |
| 1988 | US$ 12.017.951.724 | US$ 27.645.126.836 |
| 1987 | US$ 9.720.924.138 | US$ 26.447.263.017 |
| 1986 | US$ 11.675.344.330 | US$ 23.221.442.074 |
| 1985 | US$ 13.973.026.667 | US$ 31.243.235.781 |
| 1984 | US$ 15.003.121.140 | US$ 41.296.821.793 |
| 1983 | US$ 15.325.488.372 | US$ 49.690.593.343 |
| 1982 | US$ 16.968.302.326 | US$ 77.741.454.554 |
| 1981 | US$ 20.231.441.860 | US$ 115.769.423.162 |
| 1980 | US$ 19.286.255.814 | US$ 104.409.960.255 |
| 1979 | US$ 14.447.813.953 | US$ 61.361.500.126 |
| 1978 | US$ 9.474.348.837 | US$ 39.584.805.337 |
| 1977 | US$ 9.811.906.977 | US$ 42.599.781.848 |
| 1976 | US$ 9.339.325.581 | US$ 38.230.311.615 |
| 1975 | US$ 9.024.255.814 | US$ 34.300.542.527 |
| 1974 | US$ 11.207.186.047 | US$ 28.581.126.761 |
| 1973 | US$ 4.883.441.860 | US$ 14.903.189.968 |
| 1972 | US$ 3.254.954.545 | US$ 5.951.621.243 |
| 1971 | US$ 3.276.954.545 | US$ 3.878.685.816 |
| 1970 | US$ 2.688.022.222 | US$ 2.731.777.778 |
| 1969 | US$ 2.516.000.000 | US$ 2.161.704.511 |
| 1968 | US$ 2.537.488.889 | US$ 1.998.980.667 |
| 1967 | US$ 2.516.000.000 | - |
| 1966 | US$ 2.429.977.778 | - |
| 1965 | US$ 2.451.466.667 | - |
| 1964 | US$ 2.471.908.046 | - |
| 1963 | US$ 3.078.813.813 | - |
| 1962 | US$ 2.880.107.474 | - |
| 1961 | US$ 2.558.575.054 | - |
| 1960 | US$ 2.332.409.504 | - |
Em 2025, as exportações de bens e serviços da Venezuela foram de US$ 14,9 bilhões e as da Arábia Saudita, de US$ 380 bilhões: as da Arábia Saudita foram 26 vezes maiores. Em 1968, as exportações da Venezuela foram 27% maiores: US$ 2,54 bilhões da Venezuela e US$ 2 bilhões da Arábia Saudita.
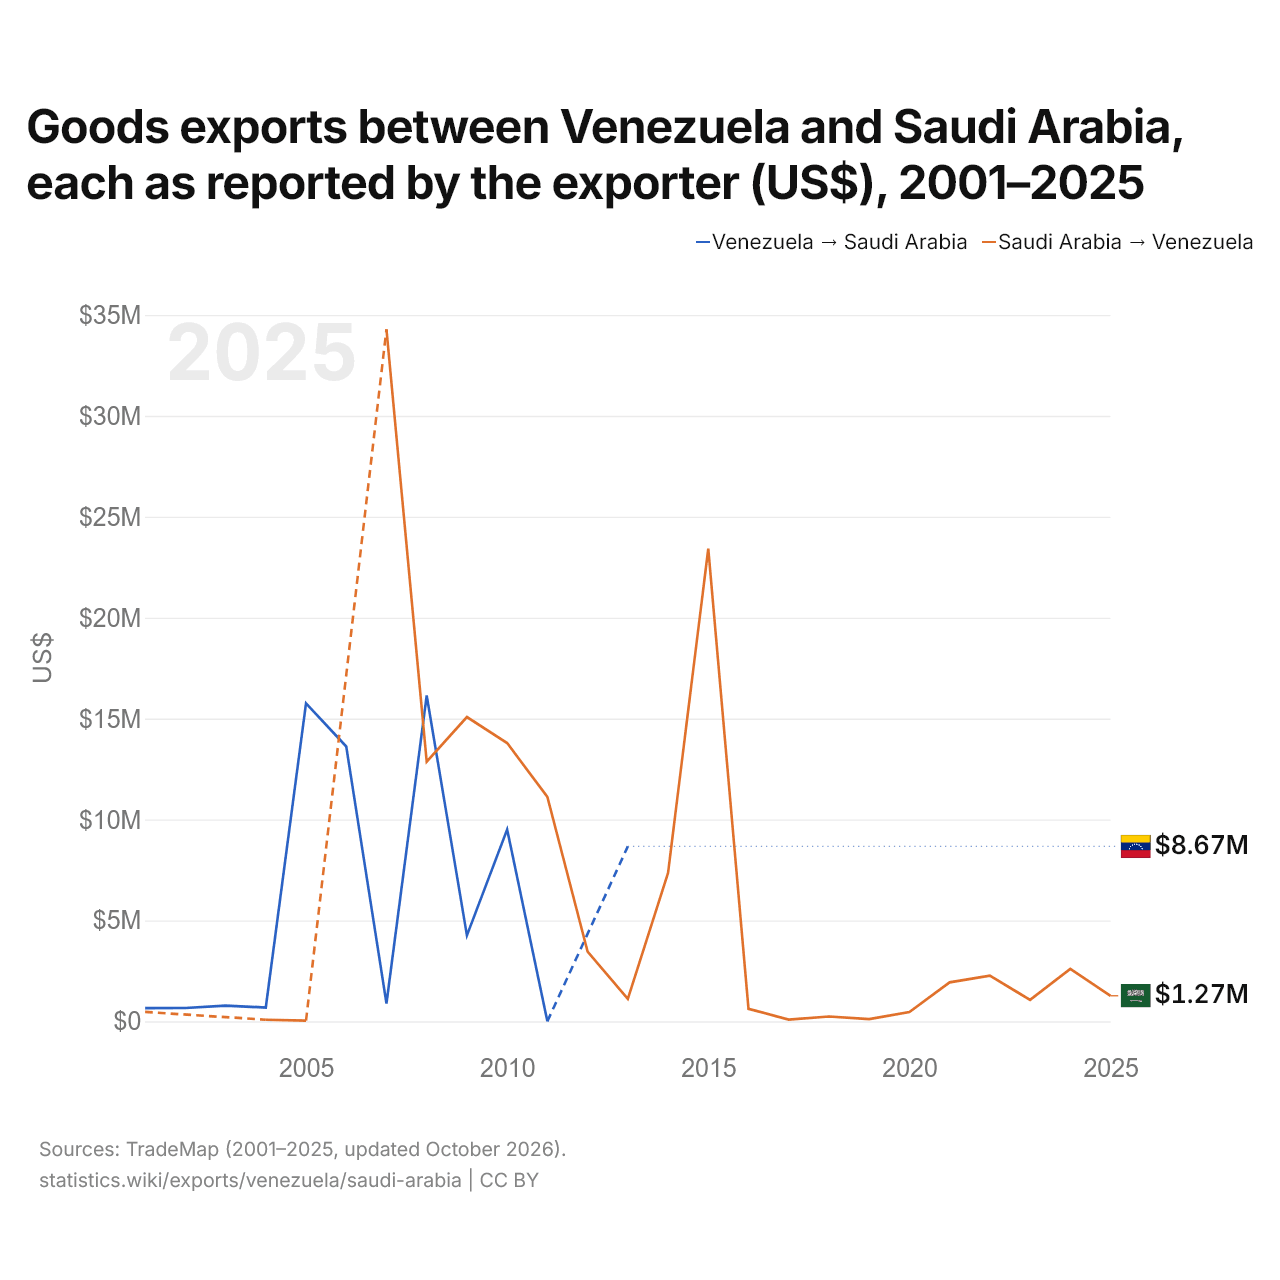
Exportações de bens entre a Venezuela e a Arábia Saudita, segundo o exportador (US$), 2001–2025
| Ano | US$ | |
|---|---|---|
| Venezuela → Arábia [...] | Arábia [...] → Venezuela | |
| 2025 | - | US$ 1.267.000 |
| 2024 | - | US$ 2.599.000 |
| 2023 | - | US$ 1.063.000 |
| 2022 | - | US$ 2.264.000 |
| 2021 | - | US$ 1.930.000 |
| 2020 | - | US$ 458.000 |
| 2019 | - | US$ 110.000 |
| 2018 | - | US$ 241.000 |
| 2017 | - | US$ 85.000 |
| 2016 | - | US$ 619.000 |
| 2015 | - | US$ 23.421.000 |
| 2014 | - | US$ 7.358.000 |
| 2013 | US$ 8.667.000 | US$ 1.112.000 |
| 2012 | - | US$ 3.459.000 |
| 2011 | US$ 1.000 | US$ 11.119.000 |
| 2010 | US$ 9.503.000 | US$ 13.789.000 |
| 2009 | US$ 4.259.000 | US$ 15.079.000 |
| 2008 | US$ 16.145.000 | US$ 12.863.000 |
| 2007 | US$ 885.000 | US$ 34.291.000 |
| 2006 | US$ 13.620.000 | - |
| 2005 | US$ 15.757.000 | US$ 34.000 |
| 2004 | US$ 685.000 | US$ 80.000 |
| 2003 | US$ 778.000 | - |
| 2002 | US$ 662.000 | - |
| 2001 | US$ 656.000 | US$ 465.000 |
As exportações de bens da Venezuela para a Arábia Saudita, segundo a Venezuela, foram de US$ 8,67 milhões, e as da Arábia Saudita para a Venezuela, segundo a Arábia Saudita, de US$ 1,11 milhão: 7,8 vezes mais da Venezuela. Em 2001, foram de US$ 656.000 da Venezuela e de US$ 465.000 da Arábia Saudita.
Venezuela vs Arábia Saudita: dados de exportações
|
Venezuela
|
Arábia Saudita
|
|
|---|---|---|
| Exportações | US$ 14,9 bi (2025) | US$ 380 bi (2025) |
| Posição mundial | 97/176 | 27/176 |
| Participação mundial | 0,04% | 1,09% |
| % do PIB | 14,9% | 29,7% |
| Maior categoria de bens | n/d | Petróleo, gás, minérios e outras matérias-primas (72,3%, 2025) |
| Principal destino dos bens | n/d | Emirados Árabes Unidos (9,19%, 2025) |
Comparar as exportações de 2 países quaisquer
Fontes:
- Banco Mundial | Economy & Growth (1960–2025, atualizado em outubro de 2026)
- TradeMap (2001–2025, atualizado em outubro de 2026)
Creative Commons Atribuição (CC BY): você pode copiar, compartilhar, adaptar e reutilizar este conteúdo, inclusive para fins comerciais, desde que cite o statistics.wiki e indique as alterações que fizer. As fontes listadas acima podem ter suas próprias condições de licença.