
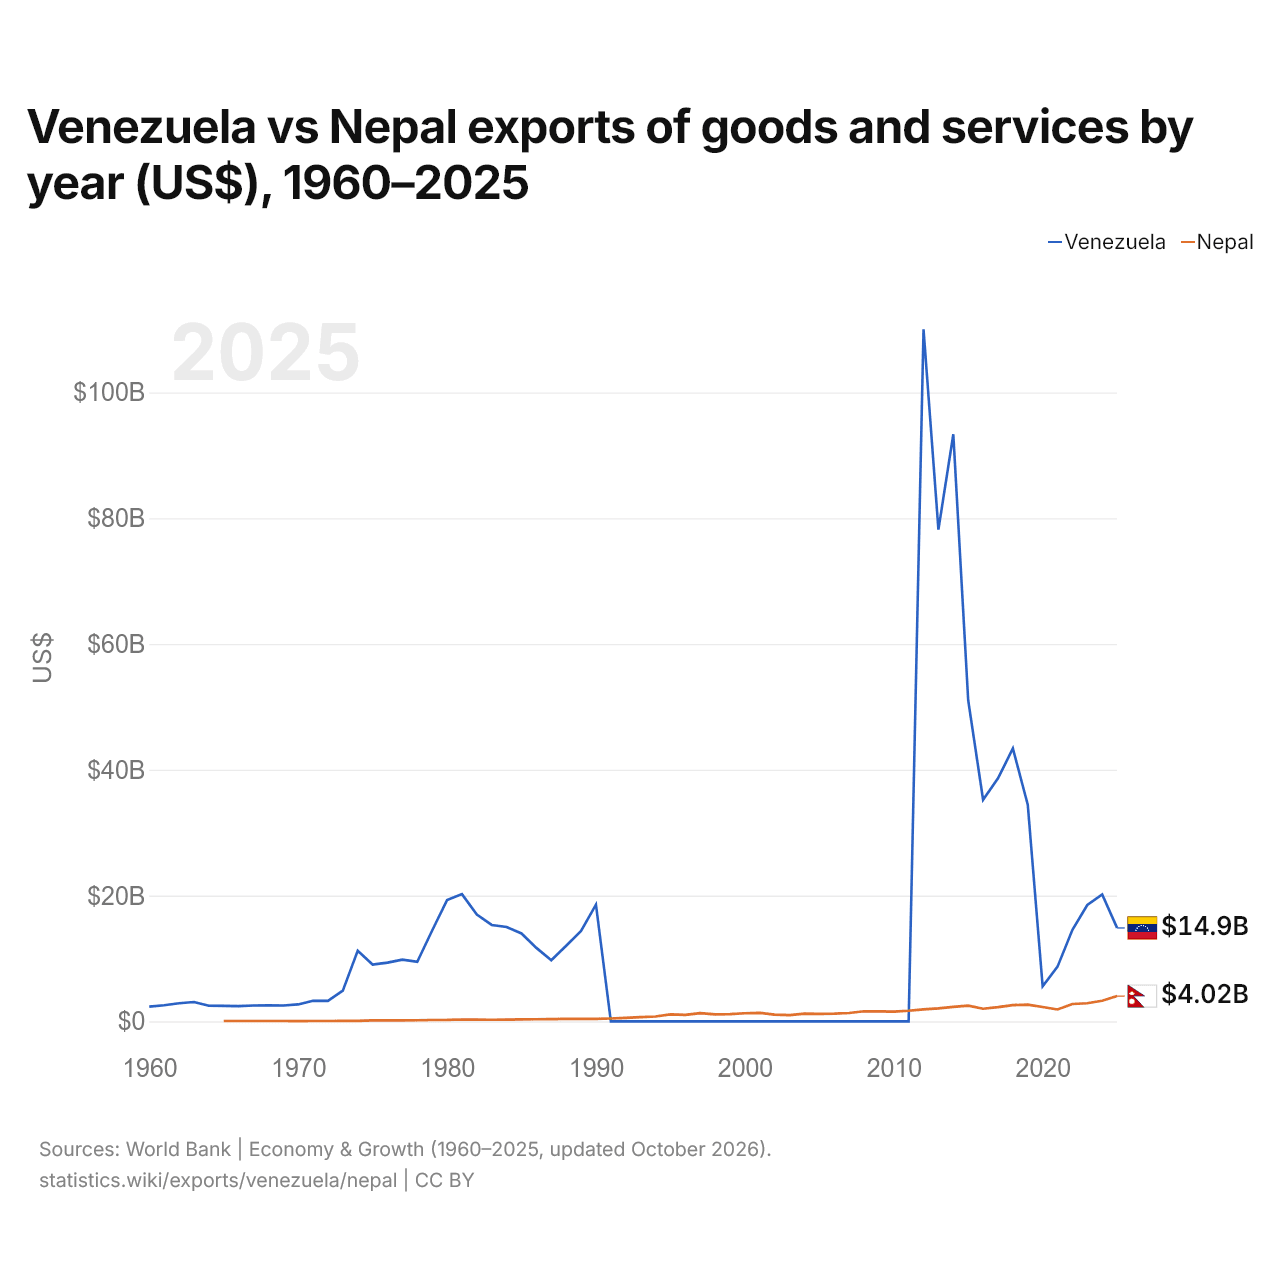
Venezuela vs Nepal: exportações de bens e serviços por ano (US$), 1960–2025
1x
| Ano | US$ | |
|---|---|---|
 Venezuela |
 Nepal |
|
| 2025 | US$ 14.852.682.003 | US$ 4.015.673.777 |
| 2024 | US$ 20.176.779.559 | US$ 3.270.900.881 |
| 2023 | US$ 18.495.894.770 | US$ 2.875.902.618 |
| 2022 | US$ 14.552.860.356 | US$ 2.760.241.576 |
| 2021 | US$ 8.690.436.504 | US$ 1.890.245.951 |
| 2020 | US$ 5.571.267.854 | US$ 2.275.260.267 |
| 2019 | US$ 34.459.561.493 | US$ 2.659.663.141 |
| 2018 | US$ 43.392.568.659 | US$ 2.587.877.950 |
| 2017 | US$ 38.630.825.248 | US$ 2.263.315.185 |
| 2016 | US$ 35.237.270.127 | US$ 2.005.968.674 |
| 2015 | US$ 51.045.259.321 | US$ 2.488.355.629 |
| 2014 | US$ 93.349.895.633 | US$ 2.301.358.066 |
| 2013 | US$ 78.189.405.110 | US$ 2.059.901.303 |
| 2012 | US$ 110.049.401.395 | US$ 1.899.084.545 |
| 2011 | US$ 0 | US$ 1.684.085.753 |
| 2010 | US$ 0 | US$ 1.533.460.341 |
| 2009 | US$ 0 | US$ 1.596.506.175 |
| 2008 | US$ 0 | US$ 1.602.782.687 |
| 2007 | US$ 0 | US$ 1.327.426.849 |
| 2006 | US$ 0 | US$ 1.216.071.411 |
| 2005 | US$ 0 | US$ 1.185.691.417 |
| 2004 | US$ 0 | US$ 1.213.488.963 |
| 2003 | US$ 0 | US$ 993.875.698 |
| 2002 | US$ 0 | US$ 1.073.251.679 |
| 2001 | US$ 0 | US$ 1.355.238.095 |
| 2000 | US$ 0 | US$ 1.279.281.888 |
| 1999 | US$ 0 | US$ 1.150.110.375 |
| 1998 | US$ 0 | US$ 1.108.297.014 |
| 1997 | US$ 0 | US$ 1.294.985.096 |
| 1996 | US$ 0 | US$ 1.031.715.001 |
| 1995 | US$ 0 | US$ 1.099.094.803 |
| 1994 | US$ 0 | US$ 772.440.816 |
| 1993 | US$ 0 | US$ 674.654.167 |
| 1992 | US$ 0 | US$ 542.824.053 |
| 1991 | US$ 0 | US$ 450.607.064 |
| 1990 | US$ 18.555.857.828 | US$ 381.884.480 |
| 1989 | US$ 14.376.184.482 | US$ 390.158.053 |
| 1988 | US$ 12.017.951.724 | US$ 399.163.908 |
| 1987 | US$ 9.720.924.138 | US$ 349.348.713 |
| 1986 | US$ 11.675.344.330 | US$ 332.466.752 |
| 1985 | US$ 13.973.026.667 | US$ 302.055.496 |
| 1984 | US$ 15.003.121.140 | US$ 274.961.829 |
| 1983 | US$ 15.325.488.372 | US$ 250.371.505 |
| 1982 | US$ 16.968.302.326 | US$ 277.667.558 |
| 1981 | US$ 20.231.441.860 | US$ 293.583.342 |
| 1980 | US$ 19.286.255.814 | US$ 224.583.342 |
| 1979 | US$ 14.447.813.953 | US$ 218.166.658 |
| 1978 | US$ 9.474.348.837 | US$ 169.586.602 |
| 1977 | US$ 9.811.906.977 | US$ 162.959.992 |
| 1976 | US$ 9.339.325.581 | US$ 156.521.017 |
| 1975 | US$ 9.024.255.814 | US$ 140.262.467 |
| 1974 | US$ 11.207.186.047 | US$ 66.375.048 |
| 1973 | US$ 4.883.441.860 | US$ 64.260.709 |
| 1972 | US$ 3.254.954.545 | US$ 57.975.286 |
| 1971 | US$ 3.276.954.545 | US$ 47.703.704 |
| 1970 | US$ 2.688.022.222 | US$ 42.469.136 |
| 1969 | US$ 2.516.000.000 | US$ 55.308.642 |
| 1968 | US$ 2.537.488.889 | US$ 52.860.114 |
| 1967 | US$ 2.516.000.000 | US$ 57.881.612 |
| 1966 | US$ 2.429.977.778 | US$ 51.187.820 |
| 1965 | US$ 2.451.466.667 | US$ 57.094.107 |
| 1964 | US$ 2.471.908.046 | - |
| 1963 | US$ 3.078.813.813 | - |
| 1962 | US$ 2.880.107.474 | - |
| 1961 | US$ 2.558.575.054 | - |
| 1960 | US$ 2.332.409.504 | - |
Em 2025, as exportações de bens e serviços da Venezuela foram de US$ 14,9 bilhões e as do Nepal, de US$ 4,02 bilhões: as da Venezuela foram 3,7 vezes maiores. Em 1965, as exportações da Venezuela foram 43 vezes maiores: US$ 2,45 bilhões da Venezuela e US$ 57,1 milhões do Nepal.
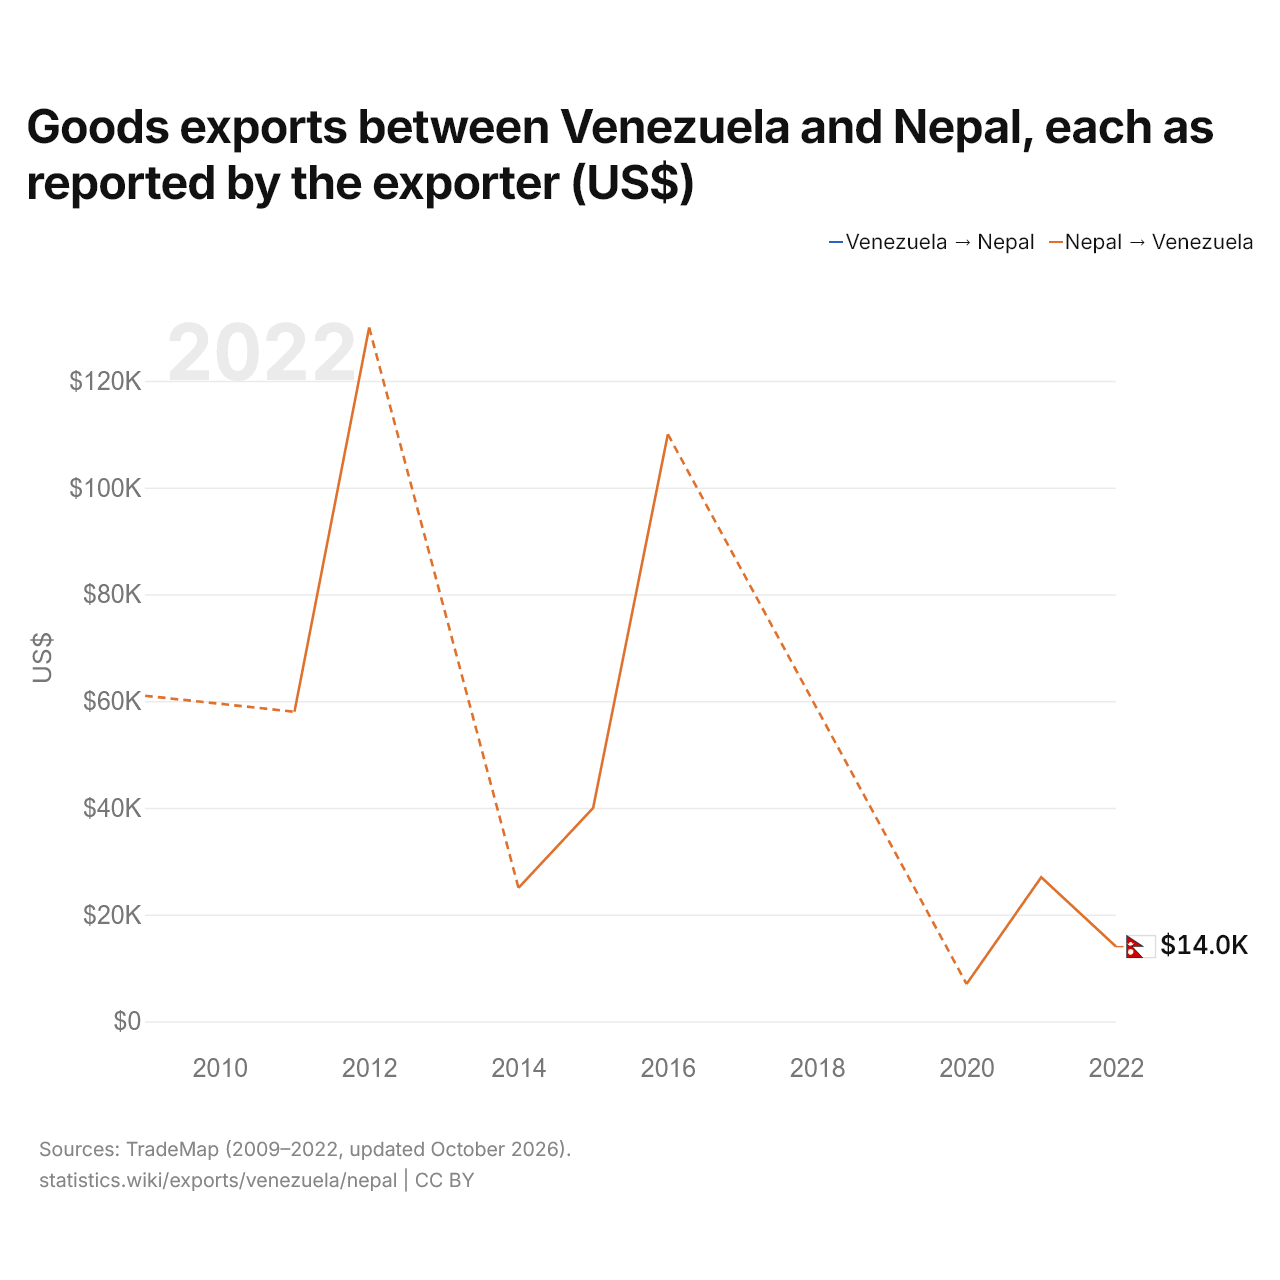
Exportações de bens entre a Venezuela e o Nepal, segundo o exportador (US$)
1x
| Ano | US$ | |
|---|---|---|
| Venezuela → Nepal | Nepal → Venezuela | |
| 2022 | - | US$ 14.000 |
| 2021 | - | US$ 27.000 |
| 2020 | - | US$ 7.000 |
| 2019 | - | - |
| 2018 | - | - |
| 2017 | - | - |
| 2016 | - | US$ 110.000 |
| 2015 | - | US$ 40.000 |
| 2014 | - | US$ 25.000 |
| 2013 | - | - |
| 2012 | - | US$ 130.000 |
| 2011 | - | US$ 58.000 |
| 2010 | - | - |
| 2009 | - | US$ 61.000 |
Segundo o Nepal, suas exportações de bens para a Venezuela são de US$ 14.000 (2022), ante US$ 61.000 em 2009.
Venezuela vs Nepal: dados de exportações
|
Venezuela
|
Nepal
|
|
|---|---|---|
| Exportações | US$ 14,9 bi (2025) | US$ 4,02 bi (2025) |
| Posição mundial | 97/176 | 137/176 |
| Participação mundial | 0,04% | 0,01% |
| % do PIB | 14,9% | 8,8% |
| Maior categoria de bens | n/d | Alimentos processados, óleos, rações, bebidas e tabaco (39,9%, 2022) |
| Principal destino dos bens | n/d | Índia (71,9%, 2022) |
Comparar as exportações de 2 países quaisquer
Fontes:
- Banco Mundial | Economy & Growth (1960–2025, atualizado em outubro de 2026)
- TradeMap (2009–2022, atualizado em outubro de 2026)
Creative Commons Atribuição (CC BY): você pode copiar, compartilhar, adaptar e reutilizar este conteúdo, inclusive para fins comerciais, desde que cite o statistics.wiki e indique as alterações que fizer. As fontes listadas acima podem ter suas próprias condições de licença.