
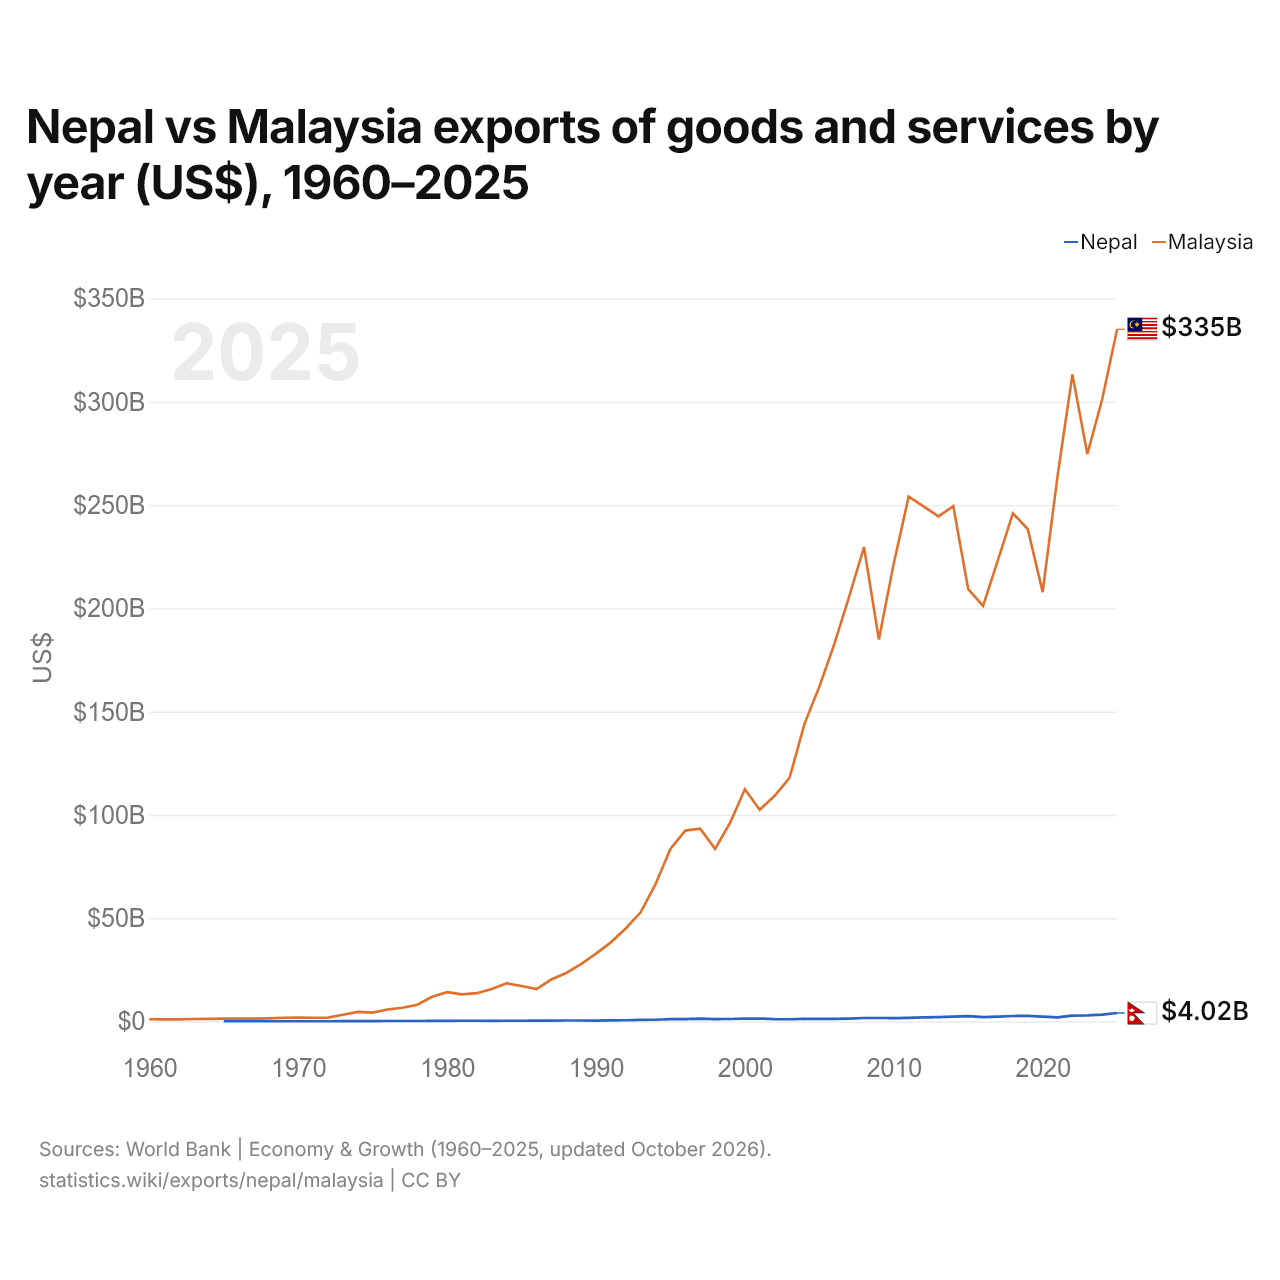
Nepal vs Malásia: exportações de bens e serviços por ano (US$), 1960–2025
| Ano | US$ | |
|---|---|---|
 Nepal |
 Malásia |
|
| 2025 | US$ 4.015.673.777 | US$ 335.105.024.619 |
| 2024 | US$ 3.270.900.881 | US$ 301.221.326.764 |
| 2023 | US$ 2.875.902.618 | US$ 274.681.075.590 |
| 2022 | US$ 2.760.241.576 | US$ 313.245.644.474 |
| 2021 | US$ 1.890.245.951 | US$ 264.015.450.976 |
| 2020 | US$ 2.275.260.267 | US$ 207.798.540.353 |
| 2019 | US$ 2.659.663.141 | US$ 238.379.861.290 |
| 2018 | US$ 2.587.877.950 | US$ 245.967.590.635 |
| 2017 | US$ 2.263.315.185 | US$ 223.413.837.325 |
| 2016 | US$ 2.005.968.674 | US$ 201.165.058.575 |
| 2015 | US$ 2.488.355.629 | US$ 209.287.287.857 |
| 2014 | US$ 2.301.358.066 | US$ 249.470.799.240 |
| 2013 | US$ 2.059.901.303 | US$ 244.490.716.806 |
| 2012 | US$ 1.899.084.545 | US$ 249.353.066.125 |
| 2011 | US$ 1.684.085.753 | US$ 254.020.012.399 |
| 2010 | US$ 1.533.460.341 | US$ 221.687.585.588 |
| 2009 | US$ 1.596.506.175 | US$ 184.897.274.878 |
| 2008 | US$ 1.602.782.687 | US$ 229.656.580.530 |
| 2007 | US$ 1.327.426.849 | US$ 205.488.238.927 |
| 2006 | US$ 1.216.071.411 | US$ 182.517.092.278 |
| 2005 | US$ 1.185.691.417 | US$ 162.048.875.496 |
| 2004 | US$ 1.213.488.963 | US$ 143.927.631.579 |
| 2003 | US$ 993.875.698 | US$ 117.854.210.526 |
| 2002 | US$ 1.073.251.679 | US$ 109.221.052.632 |
| 2001 | US$ 1.355.238.095 | US$ 102.435.789.474 |
| 2000 | US$ 1.279.281.888 | US$ 112.369.210.526 |
| 1999 | US$ 1.150.110.375 | US$ 96.016.052.632 |
| 1998 | US$ 1.108.297.014 | US$ 83.529.351.814 |
| 1997 | US$ 1.294.985.096 | US$ 93.294.414.082 |
| 1996 | US$ 1.031.715.001 | US$ 92.359.488.036 |
| 1995 | US$ 1.099.094.803 | US$ 83.462.121.212 |
| 1994 | US$ 772.440.816 | US$ 66.398.033.836 |
| 1993 | US$ 674.654.167 | US$ 52.793.700.310 |
| 1992 | US$ 542.824.053 | US$ 44.957.788.511 |
| 1991 | US$ 450.607.064 | US$ 38.245.926.680 |
| 1990 | US$ 381.884.480 | US$ 32.783.400.342 |
| 1989 | US$ 390.158.053 | US$ 27.728.453.708 |
| 1988 | US$ 399.163.908 | US$ 23.426.148.711 |
| 1987 | US$ 349.348.713 | US$ 20.240.209.109 |
| 1986 | US$ 332.466.752 | US$ 15.613.366.483 |
| 1985 | US$ 302.055.496 | US$ 17.131.003.020 |
| 1984 | US$ 274.961.829 | US$ 18.420.475.482 |
| 1983 | US$ 250.371.505 | US$ 15.637.264.405 |
| 1982 | US$ 277.667.558 | US$ 13.636.254.642 |
| 1981 | US$ 293.583.342 | US$ 13.086.963.598 |
| 1980 | US$ 224.583.342 | US$ 14.091.708.190 |
| 1979 | US$ 218.166.658 | US$ 11.882.425.945 |
| 1978 | US$ 169.586.602 | US$ 8.024.465.878 |
| 1977 | US$ 162.959.992 | US$ 6.588.433.756 |
| 1976 | US$ 156.521.017 | US$ 5.726.370.459 |
| 1975 | US$ 140.262.467 | US$ 4.235.509.660 |
| 1974 | US$ 66.375.048 | US$ 4.587.741.014 |
| 1973 | US$ 64.260.709 | US$ 3.178.858.361 |
| 1972 | US$ 57.975.286 | US$ 1.816.243.409 |
| 1971 | US$ 47.703.704 | US$ 1.717.415.948 |
| 1970 | US$ 42.469.136 | US$ 1.760.409.249 |
| 1969 | US$ 55.308.642 | US$ 1.730.355.871 |
| 1968 | US$ 52.860.114 | US$ 1.439.622.111 |
| 1967 | US$ 57.881.612 | US$ 1.306.341.916 |
| 1966 | US$ 51.187.820 | US$ 1.336.395.293 |
| 1965 | US$ 57.094.107 | US$ 1.327.248.613 |
| 1964 | - | US$ 1.178.941.729 |
| 1963 | - | US$ 1.147.581.683 |
| 1962 | - | US$ 921.528.018 |
| 1961 | - | US$ 921.854.685 |
| 1960 | - | US$ 1.016.914.825 |
Em 2025, as exportações de bens e serviços do Nepal foram de US$ 4,02 bilhões e as da Malásia, de US$ 335 bilhões: as da Malásia foram 83 vezes maiores. Em 1965, as exportações da Malásia foram 23 vezes maiores: US$ 57,1 milhões do Nepal e US$ 1,33 bilhão da Malásia.
As exportações de bens e serviços da Malásia têm sido maiores que as do Nepal todos os anos desde 1965.
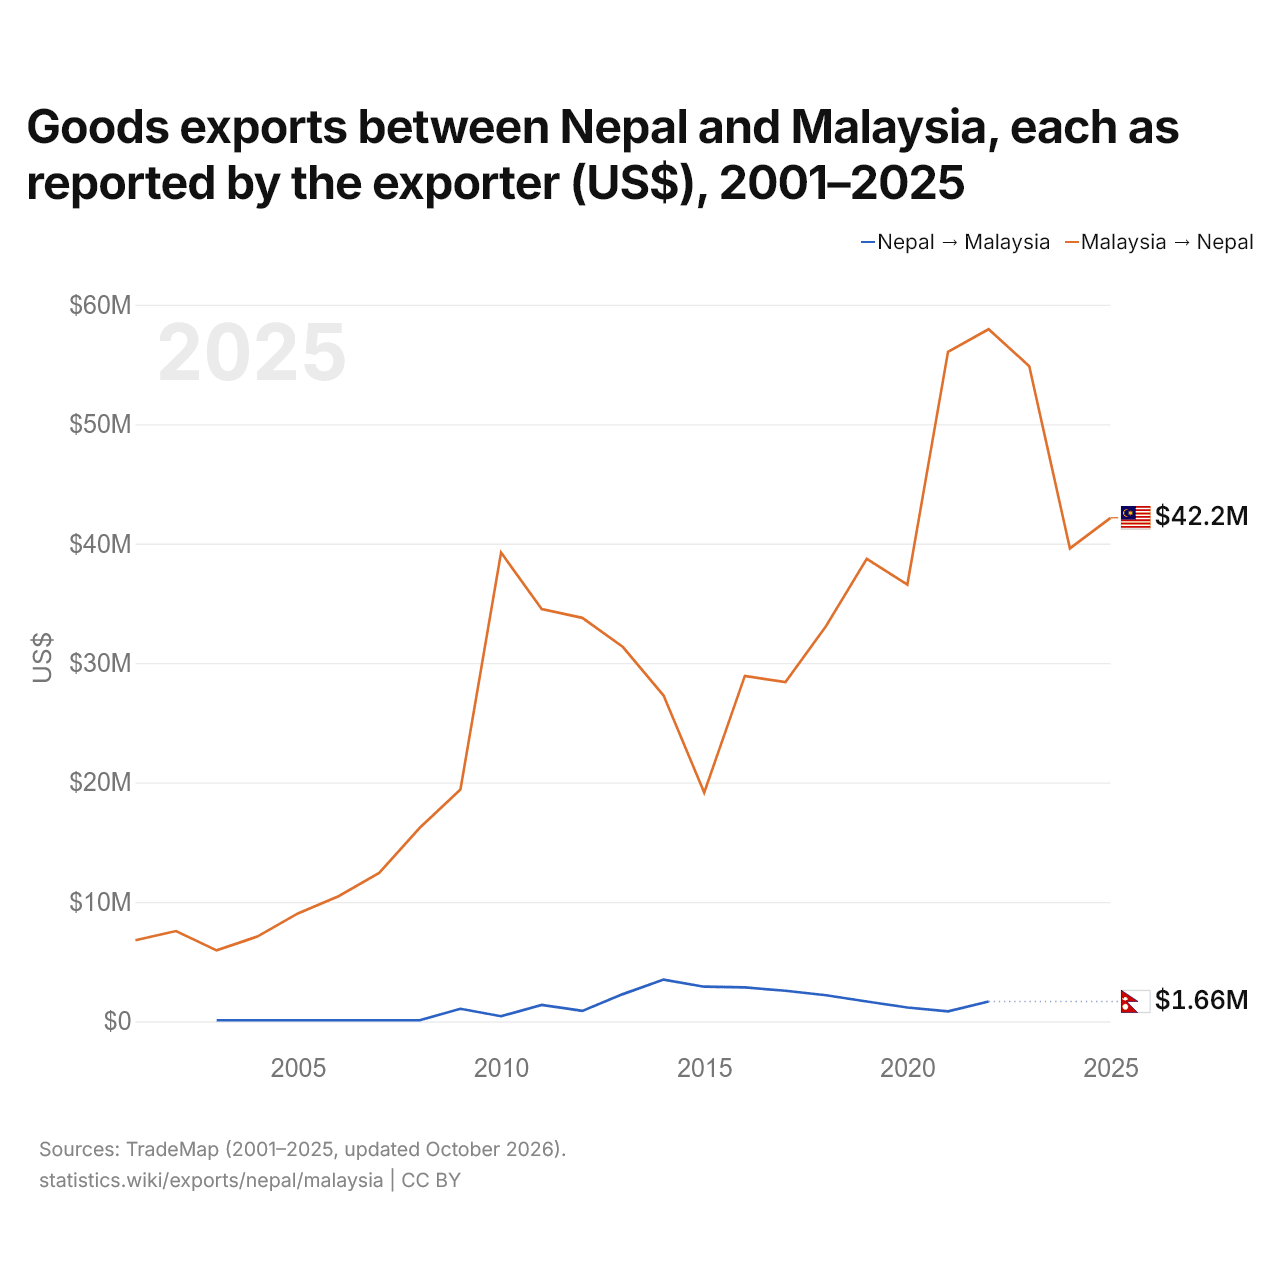
Exportações de bens entre o Nepal e a Malásia, segundo o exportador (US$), 2001–2025
| Ano | US$ | |
|---|---|---|
| Nepal → Malásia | Malásia → Nepal | |
| 2025 | - | US$ 42.158.000 |
| 2024 | - | US$ 39.594.000 |
| 2023 | - | US$ 54.854.000 |
| 2022 | US$ 1.663.000 | US$ 57.947.000 |
| 2021 | US$ 834.000 | US$ 56.051.000 |
| 2020 | US$ 1.158.000 | US$ 36.568.000 |
| 2019 | US$ 1.656.000 | US$ 38.724.000 |
| 2018 | US$ 2.182.000 | US$ 33.104.000 |
| 2017 | US$ 2.562.000 | US$ 28.397.000 |
| 2016 | US$ 2.838.000 | US$ 28.923.000 |
| 2015 | US$ 2.900.000 | US$ 19.153.000 |
| 2014 | US$ 3.494.000 | US$ 27.280.000 |
| 2013 | US$ 2.278.000 | US$ 31.339.000 |
| 2012 | US$ 875.000 | US$ 33.780.000 |
| 2011 | US$ 1.376.000 | US$ 34.509.000 |
| 2010 | US$ 430.000 | US$ 39.249.000 |
| 2009 | US$ 1.050.000 | US$ 19.410.000 |
| 2008 | US$ 93.000 | US$ 16.208.000 |
| 2007 | US$ 93.000 | US$ 12.423.000 |
| 2006 | US$ 93.000 | US$ 10.474.000 |
| 2005 | US$ 93.000 | US$ 9.033.000 |
| 2004 | US$ 93.000 | US$ 7.097.000 |
| 2003 | US$ 93.000 | US$ 5.940.000 |
| 2002 | - | US$ 7.559.000 |
| 2001 | - | US$ 6.789.000 |
As exportações de bens do Nepal para a Malásia, segundo o Nepal, foram de US$ 1,66 milhão, e as da Malásia para o Nepal, segundo a Malásia, de US$ 57,9 milhões: 35 vezes mais da Malásia. Em 2003, foram de US$ 93.000 do Nepal e de US$ 5,94 milhões da Malásia.
Nepal vs Malásia: dados de exportações
|
Nepal
|
Malásia
|
|
|---|---|---|
| Exportações | US$ 4,02 bi (2025) | US$ 335 bi (2025) |
| Posição mundial | 137/176 | 29/176 |
| Participação mundial | 0,01% | 0,96% |
| % do PIB | 8,8% | 71,0% |
| Maior categoria de bens | Alimentos processados, óleos, rações, bebidas e tabaco (39,9%, 2022) | Máquinas, eletrônicos e veículos (57,2%, 2025) |
| Principal destino dos bens | Índia (71,9%, 2022) | Singapura (15,5%, 2025) |
Comparar as exportações de 2 países quaisquer
Fontes:
- Banco Mundial | Economy & Growth (1960–2025, atualizado em outubro de 2026)
- TradeMap (2001–2025, atualizado em outubro de 2026)
Creative Commons Atribuição (CC BY): você pode copiar, compartilhar, adaptar e reutilizar este conteúdo, inclusive para fins comerciais, desde que cite o statistics.wiki e indique as alterações que fizer. As fontes listadas acima podem ter suas próprias condições de licença.