
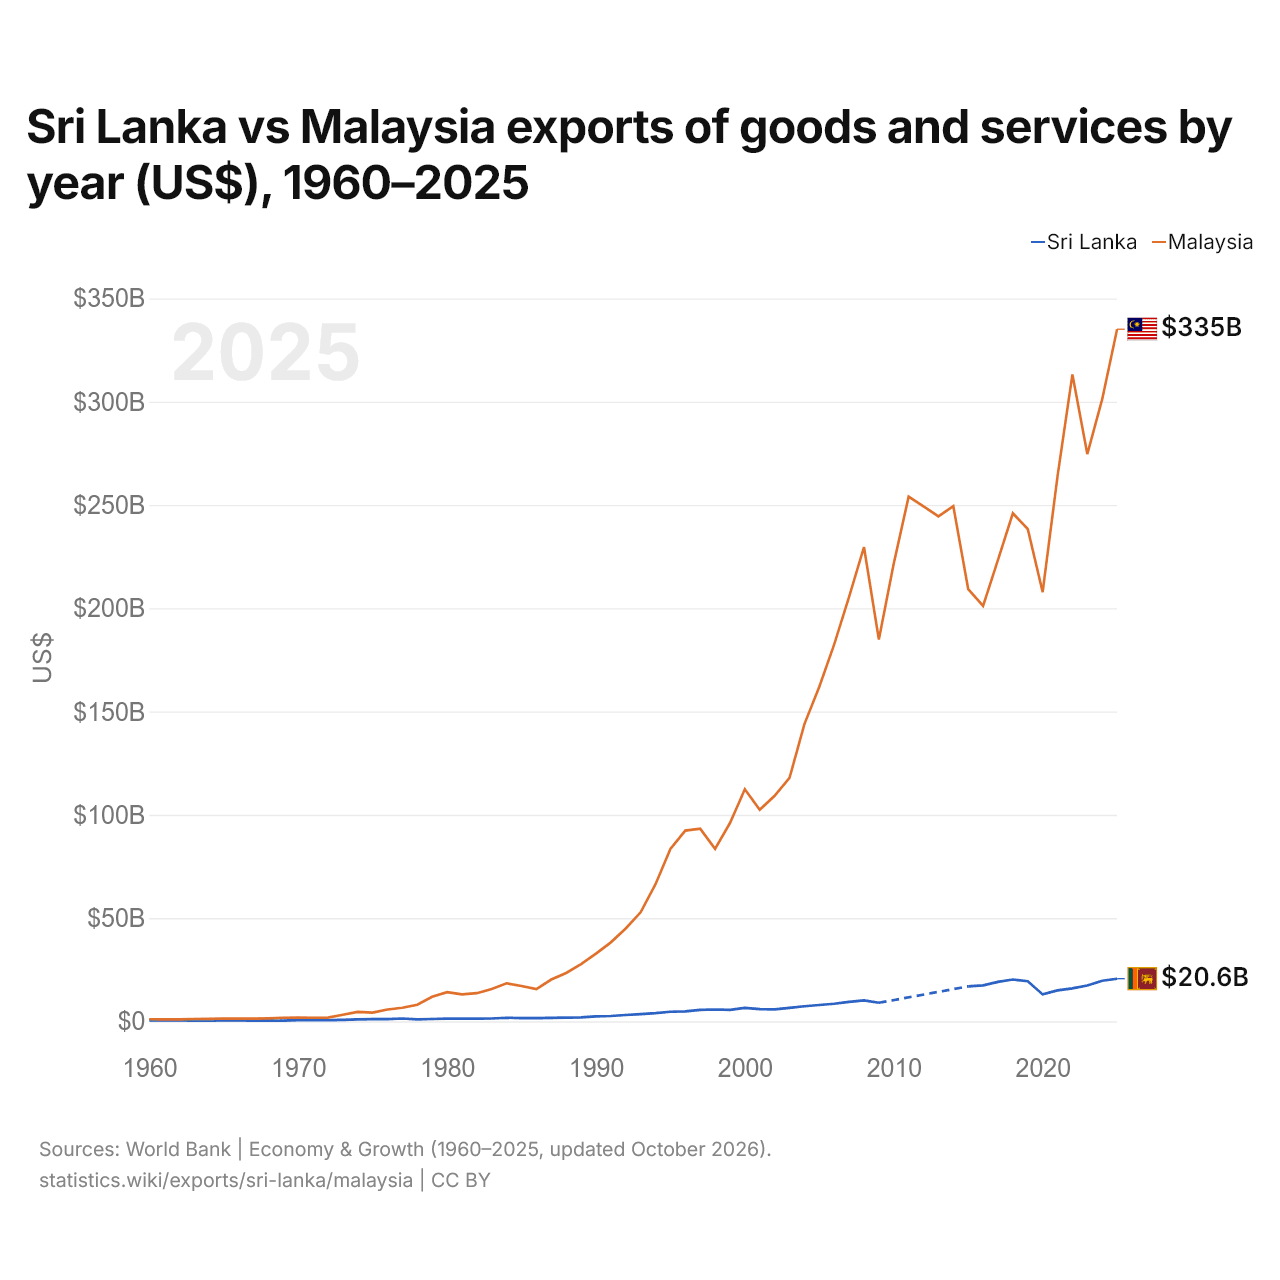
Sri Lanka vs Malásia: exportações de bens e serviços por ano (US$), 1960–2025
| Ano | US$ | |
|---|---|---|
 Sri Lanka |
 Malásia |
|
| 2025 | US$ 20.641.294.806 | US$ 335.105.024.619 |
| 2024 | US$ 19.680.136.442 | US$ 301.221.326.764 |
| 2023 | US$ 17.320.146.765 | US$ 274.681.075.590 |
| 2022 | US$ 15.984.910.773 | US$ 313.245.644.474 |
| 2021 | US$ 14.985.052.393 | US$ 264.015.450.976 |
| 2020 | US$ 13.036.289.408 | US$ 207.798.540.353 |
| 2019 | US$ 19.422.660.165 | US$ 238.379.861.290 |
| 2018 | US$ 20.255.985.244 | US$ 245.967.590.635 |
| 2017 | US$ 19.085.446.206 | US$ 223.413.837.325 |
| 2016 | US$ 17.445.193.522 | US$ 201.165.058.575 |
| 2015 | US$ 16.927.340.151 | US$ 209.287.287.857 |
| 2014 | - | US$ 249.470.799.240 |
| 2013 | - | US$ 244.490.716.806 |
| 2012 | - | US$ 249.353.066.125 |
| 2011 | - | US$ 254.020.012.399 |
| 2010 | - | US$ 221.687.585.588 |
| 2009 | US$ 8.972.038.339 | US$ 184.897.274.878 |
| 2008 | US$ 10.113.919.887 | US$ 229.656.580.530 |
| 2007 | US$ 9.418.771.914 | US$ 205.488.238.927 |
| 2006 | US$ 8.516.554.444 | US$ 182.517.092.278 |
| 2005 | US$ 7.892.069.652 | US$ 162.048.875.496 |
| 2004 | US$ 7.300.256.942 | US$ 143.927.631.579 |
| 2003 | US$ 6.543.193.121 | US$ 117.854.210.526 |
| 2002 | US$ 5.773.455.294 | US$ 109.221.052.632 |
| 2001 | US$ 5.879.570.278 | US$ 102.435.789.474 |
| 2000 | US$ 6.475.000.000 | US$ 112.369.210.526 |
| 1999 | US$ 5.575.176.093 | US$ 96.016.052.632 |
| 1998 | US$ 5.712.292.925 | US$ 83.529.351.814 |
| 1997 | US$ 5.514.301.315 | US$ 93.294.414.082 |
| 1996 | US$ 4.860.502.985 | US$ 92.359.488.036 |
| 1995 | US$ 4.638.263.415 | US$ 83.462.121.212 |
| 1994 | US$ 3.962.059.895 | US$ 66.398.033.836 |
| 1993 | US$ 3.494.577.815 | US$ 52.793.700.310 |
| 1992 | US$ 3.082.683.094 | US$ 44.957.788.511 |
| 1991 | US$ 2.586.802.030 | US$ 38.245.926.680 |
| 1990 | US$ 2.424.288.567 | US$ 32.783.400.342 |
| 1989 | US$ 1.904.743.412 | US$ 27.728.453.708 |
| 1988 | US$ 1.819.710.783 | US$ 23.426.148.711 |
| 1987 | US$ 1.683.389.946 | US$ 20.240.209.109 |
| 1986 | US$ 1.519.200.571 | US$ 15.613.366.483 |
| 1985 | US$ 1.555.117.820 | US$ 17.131.003.020 |
| 1984 | US$ 1.740.762.579 | US$ 18.420.475.482 |
| 1983 | US$ 1.360.645.984 | US$ 15.637.264.405 |
| 1982 | US$ 1.304.565.113 | US$ 13.636.254.642 |
| 1981 | US$ 1.345.038.961 | US$ 13.086.963.598 |
| 1980 | US$ 1.296.672.716 | US$ 14.091.708.190 |
| 1979 | US$ 1.134.232.498 | US$ 11.882.425.945 |
| 1978 | US$ 950.352.338 | US$ 8.024.465.878 |
| 1977 | US$ 1.387.936.866 | US$ 6.588.433.756 |
| 1976 | US$ 1.043.162.901 | US$ 5.726.370.459 |
| 1975 | US$ 1.042.225.392 | US$ 4.235.509.660 |
| 1974 | US$ 944.812.030 | US$ 4.587.741.014 |
| 1973 | US$ 700.156.250 | US$ 3.178.858.361 |
| 1972 | US$ 570.184.255 | US$ 1.816.243.409 |
| 1971 | US$ 583.136.594 | US$ 1.717.415.948 |
| 1970 | US$ 584.537.815 | US$ 1.760.409.249 |
| 1969 | US$ 361.512.605 | US$ 1.730.355.871 |
| 1968 | US$ 371.463.229 | US$ 1.439.622.111 |
| 1967 | US$ 380.452.675 | US$ 1.306.341.916 |
| 1966 | US$ 391.806.723 | US$ 1.336.395.293 |
| 1965 | US$ 439.915.966 | US$ 1.327.248.613 |
| 1964 | US$ 322.401.284 | US$ 1.178.941.729 |
| 1963 | US$ 319.557.569 | US$ 1.147.581.683 |
| 1962 | US$ 398.590.402 | US$ 921.528.018 |
| 1961 | US$ 397.732.380 | US$ 921.854.685 |
| 1960 | US$ 422.303.067 | US$ 1.016.914.825 |
Em 2025, as exportações de bens e serviços do Sri Lanka foram de US$ 20,6 bilhões e as da Malásia, de US$ 335 bilhões: as da Malásia foram 16 vezes maiores. Em 1960, as exportações da Malásia foram 2,4 vezes maiores: US$ 422 milhões do Sri Lanka e US$ 1,02 bilhão da Malásia.
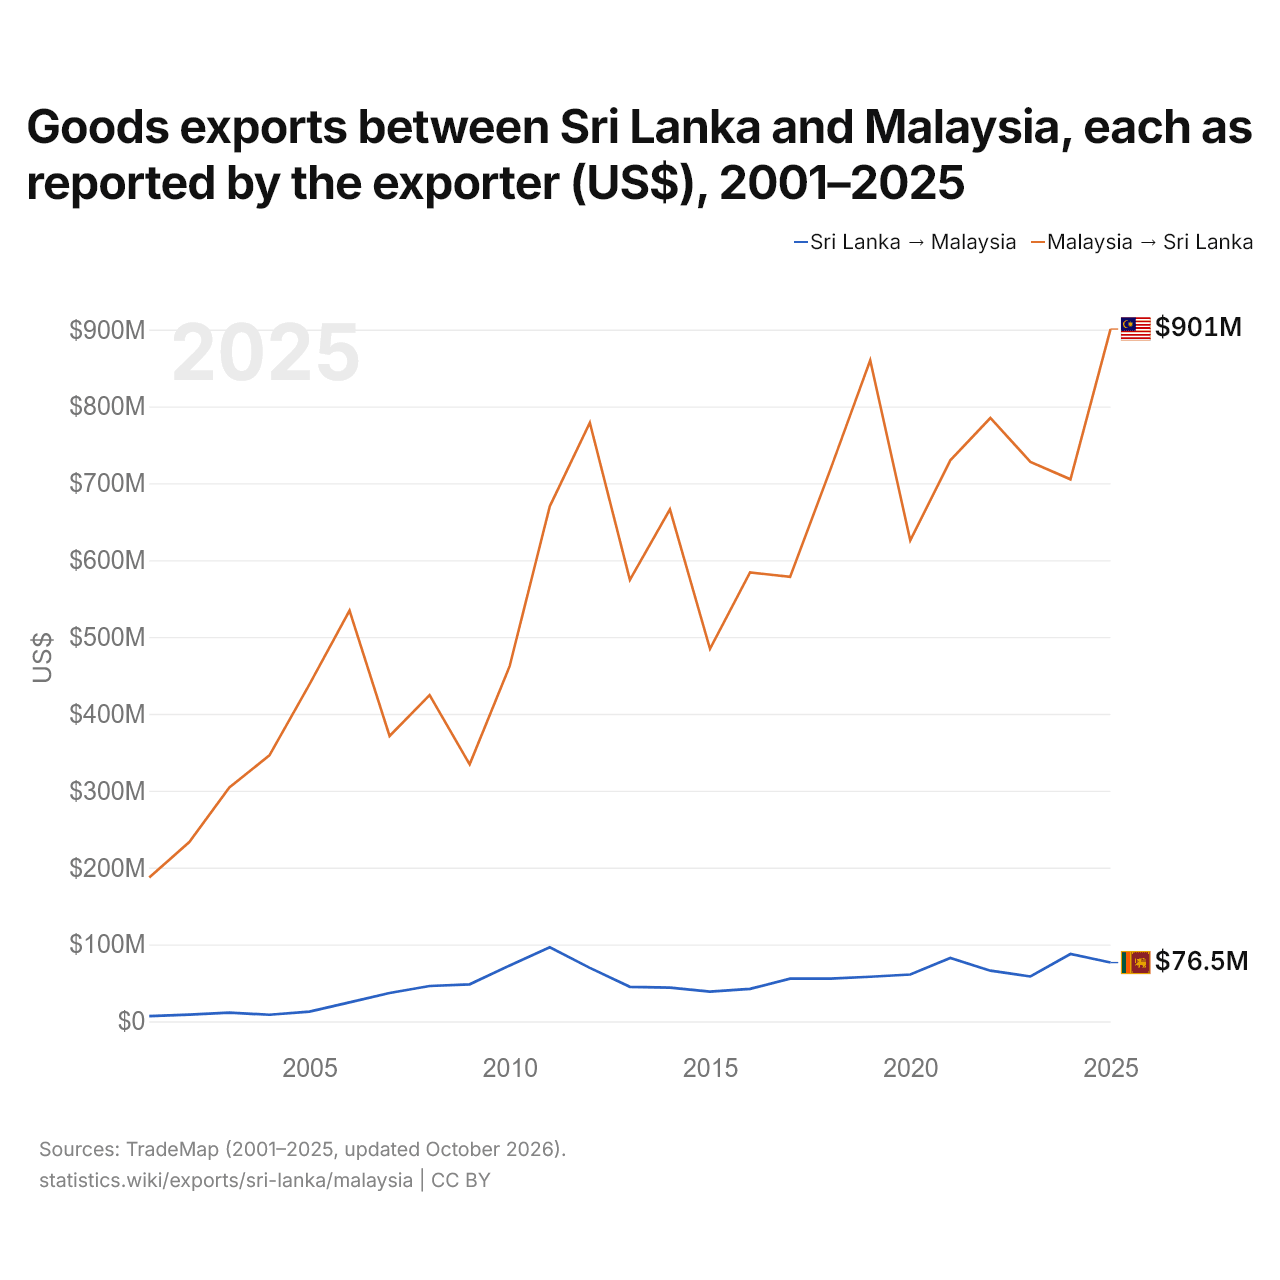
Exportações de bens entre o Sri Lanka e a Malásia, segundo o exportador (US$), 2001–2025
| Ano | US$ | |
|---|---|---|
| Sri Lanka → Malásia | Malásia → Sri Lanka | |
| 2025 | US$ 76.462.000 | US$ 900.679.000 |
| 2024 | US$ 87.625.000 | US$ 705.139.000 |
| 2023 | US$ 58.341.000 | US$ 727.856.000 |
| 2022 | US$ 65.927.000 | US$ 784.994.000 |
| 2021 | US$ 82.457.000 | US$ 729.928.000 |
| 2020 | US$ 60.943.000 | US$ 625.621.000 |
| 2019 | US$ 58.057.000 | US$ 860.031.000 |
| 2018 | US$ 55.513.000 | US$ 717.102.000 |
| 2017 | US$ 55.513.000 | US$ 578.221.000 |
| 2016 | US$ 42.197.000 | US$ 584.030.000 |
| 2015 | US$ 38.598.000 | US$ 484.530.000 |
| 2014 | US$ 43.953.000 | US$ 666.089.000 |
| 2013 | US$ 44.899.000 | US$ 574.288.000 |
| 2012 | US$ 69.584.000 | US$ 778.708.000 |
| 2011 | US$ 96.325.000 | US$ 670.038.000 |
| 2010 | US$ 72.704.000 | US$ 462.416.000 |
| 2009 | US$ 48.157.000 | US$ 334.279.000 |
| 2008 | US$ 45.981.000 | US$ 424.379.000 |
| 2007 | US$ 36.800.000 | US$ 371.166.000 |
| 2006 | US$ 24.633.000 | US$ 534.397.000 |
| 2005 | US$ 12.603.000 | US$ 438.413.000 |
| 2004 | US$ 8.534.000 | US$ 346.005.000 |
| 2003 | US$ 11.349.000 | US$ 304.238.000 |
| 2002 | US$ 8.670.000 | US$ 233.290.000 |
| 2001 | US$ 6.712.000 | US$ 187.001.000 |
Em 2025, as exportações de bens do Sri Lanka para a Malásia, segundo o Sri Lanka, foram de US$ 76,5 milhões, e as da Malásia para o Sri Lanka, segundo a Malásia, de US$ 901 milhões: 12 vezes mais da Malásia. Em 2001, foram de US$ 6,71 milhões do Sri Lanka e de US$ 187 milhões da Malásia.
Sri Lanka vs Malásia: dados de exportações
|
Sri Lanka
|
Malásia
|
|
|---|---|---|
| Exportações | US$ 20,6 bi (2025) | US$ 335 bi (2025) |
| Posição mundial | 89/176 | 29/176 |
| Participação mundial | 0,06% | 0,96% |
| % do PIB | 19,0% | 71,0% |
| Maior categoria de bens | Têxteis, roupas, calçados, móveis e brinquedos (44,1%, 2025) | Máquinas, eletrônicos e veículos (57,2%, 2025) |
| Principal destino dos bens | Estados Unidos (22,7%, 2025) | Singapura (15,5%, 2025) |
Comparar as exportações de 2 países quaisquer
Fontes:
- Banco Mundial | Economy & Growth (1960–2025, atualizado em outubro de 2026)
- TradeMap (2001–2025, atualizado em outubro de 2026)
Creative Commons Atribuição (CC BY): você pode copiar, compartilhar, adaptar e reutilizar este conteúdo, inclusive para fins comerciais, desde que cite o statistics.wiki e indique as alterações que fizer. As fontes listadas acima podem ter suas próprias condições de licença.