
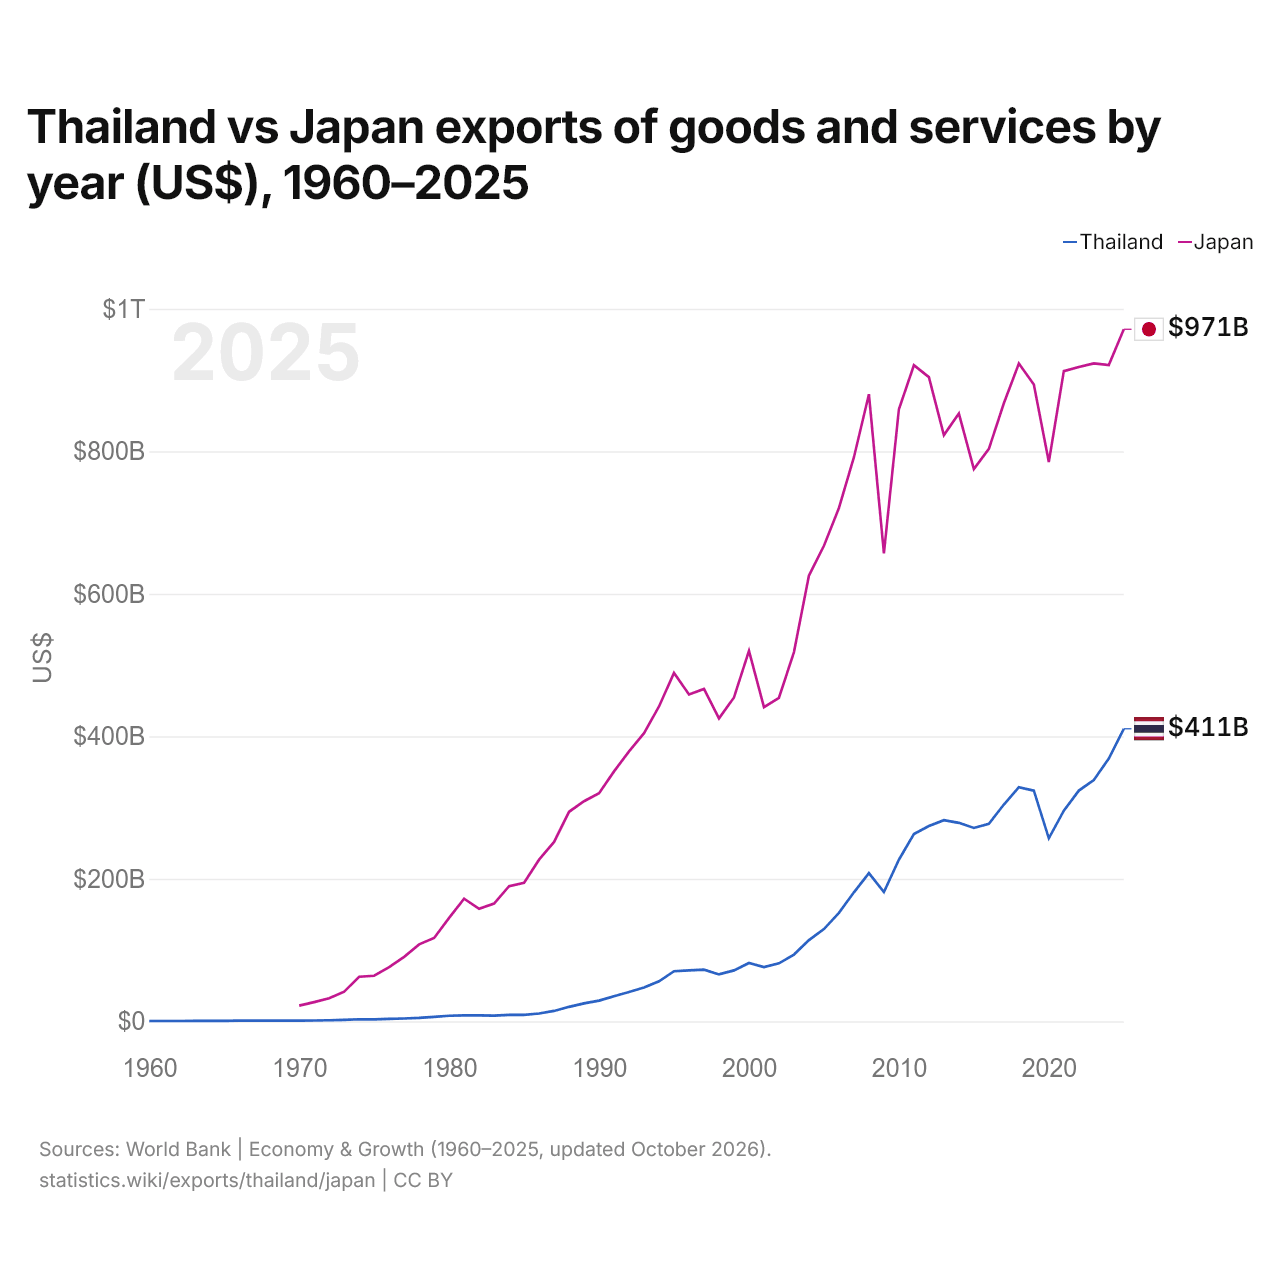
Tailândia vs Japão: exportações de bens e serviços por ano (US$), 1960–2025
| Ano | US$ | |
|---|---|---|
 Tailândia |
 Japão |
|
| 2025 | US$ 410.531.624.594 | US$ 971.285.188.334 |
| 2024 | US$ 368.836.810.863 | US$ 920.960.002.390 |
| 2023 | US$ 338.714.010.202 | US$ 923.420.059.651 |
| 2022 | US$ 323.854.472.232 | US$ 918.412.226.914 |
| 2021 | US$ 295.639.913.234 | US$ 912.551.747.360 |
| 2020 | US$ 256.835.239.507 | US$ 785.057.625.362 |
| 2019 | US$ 323.768.892.197 | US$ 893.761.110.034 |
| 2018 | US$ 328.569.784.687 | US$ 923.192.943.803 |
| 2017 | US$ 304.266.013.738 | US$ 867.373.157.903 |
| 2016 | US$ 277.248.464.807 | US$ 803.470.630.550 |
| 2015 | US$ 271.423.493.718 | US$ 775.031.229.091 |
| 2014 | US$ 278.596.013.717 | US$ 852.957.541.825 |
| 2013 | US$ 282.342.912.104 | US$ 822.673.891.615 |
| 2012 | US$ 274.121.377.629 | US$ 904.081.818.095 |
| 2011 | US$ 262.743.281.925 | US$ 920.847.566.474 |
| 2010 | US$ 226.787.505.596 | US$ 859.110.359.863 |
| 2009 | US$ 181.530.421.335 | US$ 656.874.364.781 |
| 2008 | US$ 208.095.289.026 | US$ 880.075.851.760 |
| 2007 | US$ 181.094.565.788 | US$ 791.701.308.241 |
| 2006 | US$ 152.293.268.280 | US$ 720.411.902.737 |
| 2005 | US$ 129.498.934.986 | US$ 667.445.122.493 |
| 2004 | US$ 114.062.494.756 | US$ 625.631.972.494 |
| 2003 | US$ 93.686.920.142 | US$ 518.203.970.380 |
| 2002 | US$ 81.447.794.223 | US$ 454.066.577.344 |
| 2001 | US$ 76.088.350.937 | US$ 440.830.946.384 |
| 2000 | US$ 81.953.035.120 | US$ 519.863.963.885 |
| 1999 | US$ 71.490.257.382 | US$ 454.583.045.086 |
| 1998 | US$ 65.860.574.771 | US$ 425.156.200.704 |
| 1997 | US$ 72.442.635.001 | US$ 466.482.189.983 |
| 1996 | US$ 71.417.458.049 | US$ 458.650.604.758 |
| 1995 | US$ 70.305.503.762 | US$ 488.922.980.748 |
| 1994 | US$ 56.094.977.835 | US$ 441.885.061.610 |
| 1993 | US$ 47.453.533.153 | US$ 404.418.972.318 |
| 1992 | US$ 41.206.839.588 | US$ 378.894.650.114 |
| 1991 | US$ 35.329.436.945 | US$ 350.804.377.214 |
| 1990 | US$ 29.129.276.618 | US$ 320.186.473.747 |
| 1989 | US$ 25.231.065.262 | US$ 308.916.648.063 |
| 1988 | US$ 20.357.574.272 | US$ 294.106.125.787 |
| 1987 | US$ 14.601.717.480 | US$ 251.700.285.196 |
| 1986 | US$ 11.033.548.459 | US$ 226.865.329.771 |
| 1985 | US$ 9.030.266.962 | US$ 194.351.120.461 |
| 1984 | US$ 9.154.262.959 | US$ 189.758.022.924 |
| 1983 | US$ 8.053.089.819 | US$ 165.329.539.555 |
| 1982 | US$ 8.385.609.881 | US$ 157.933.279.187 |
| 1981 | US$ 8.309.867.953 | US$ 172.134.410.830 |
| 1980 | US$ 7.800.900.873 | US$ 145.104.895.105 |
| 1979 | US$ 6.178.088.809 | US$ 116.997.148.836 |
| 1978 | US$ 4.773.874.326 | US$ 108.052.061.241 |
| 1977 | US$ 3.947.627.127 | US$ 90.568.192.250 |
| 1976 | US$ 3.436.992.450 | US$ 76.182.443.149 |
| 1975 | US$ 2.732.924.326 | US$ 63.986.133.887 |
| 1974 | US$ 2.958.365.413 | US$ 62.536.307.379 |
| 1973 | US$ 2.016.289.602 | US$ 41.576.284.285 |
| 1972 | US$ 1.487.497.926 | US$ 32.270.972.031 |
| 1971 | US$ 1.179.182.692 | US$ 26.966.713.726 |
| 1970 | US$ 1.064.423.077 | US$ 22.026.785.842 |
| 1969 | US$ 1.075.384.615 | - |
| 1968 | US$ 1.030.048.077 | - |
| 1967 | US$ 1.024.038.462 | - |
| 1966 | US$ 929.903.846 | - |
| 1965 | US$ 739.759.615 | - |
| 1964 | US$ 674.951.923 | - |
| 1963 | US$ 535.813.730 | - |
| 1962 | US$ 519.061.303 | - |
| 1961 | US$ 525.964.886 | - |
| 1960 | US$ 445.713.376 | - |
Em 2025, as exportações de bens e serviços da Tailândia foram de US$ 411 bilhões e as do Japão, de US$ 971 bilhões: as do Japão foram 2,4 vezes maiores. Em 1970, as exportações do Japão foram 21 vezes maiores: US$ 1,06 bilhão da Tailândia e US$ 22 bilhões do Japão.
As exportações de bens e serviços do Japão têm sido maiores que as da Tailândia todos os anos desde 1970.
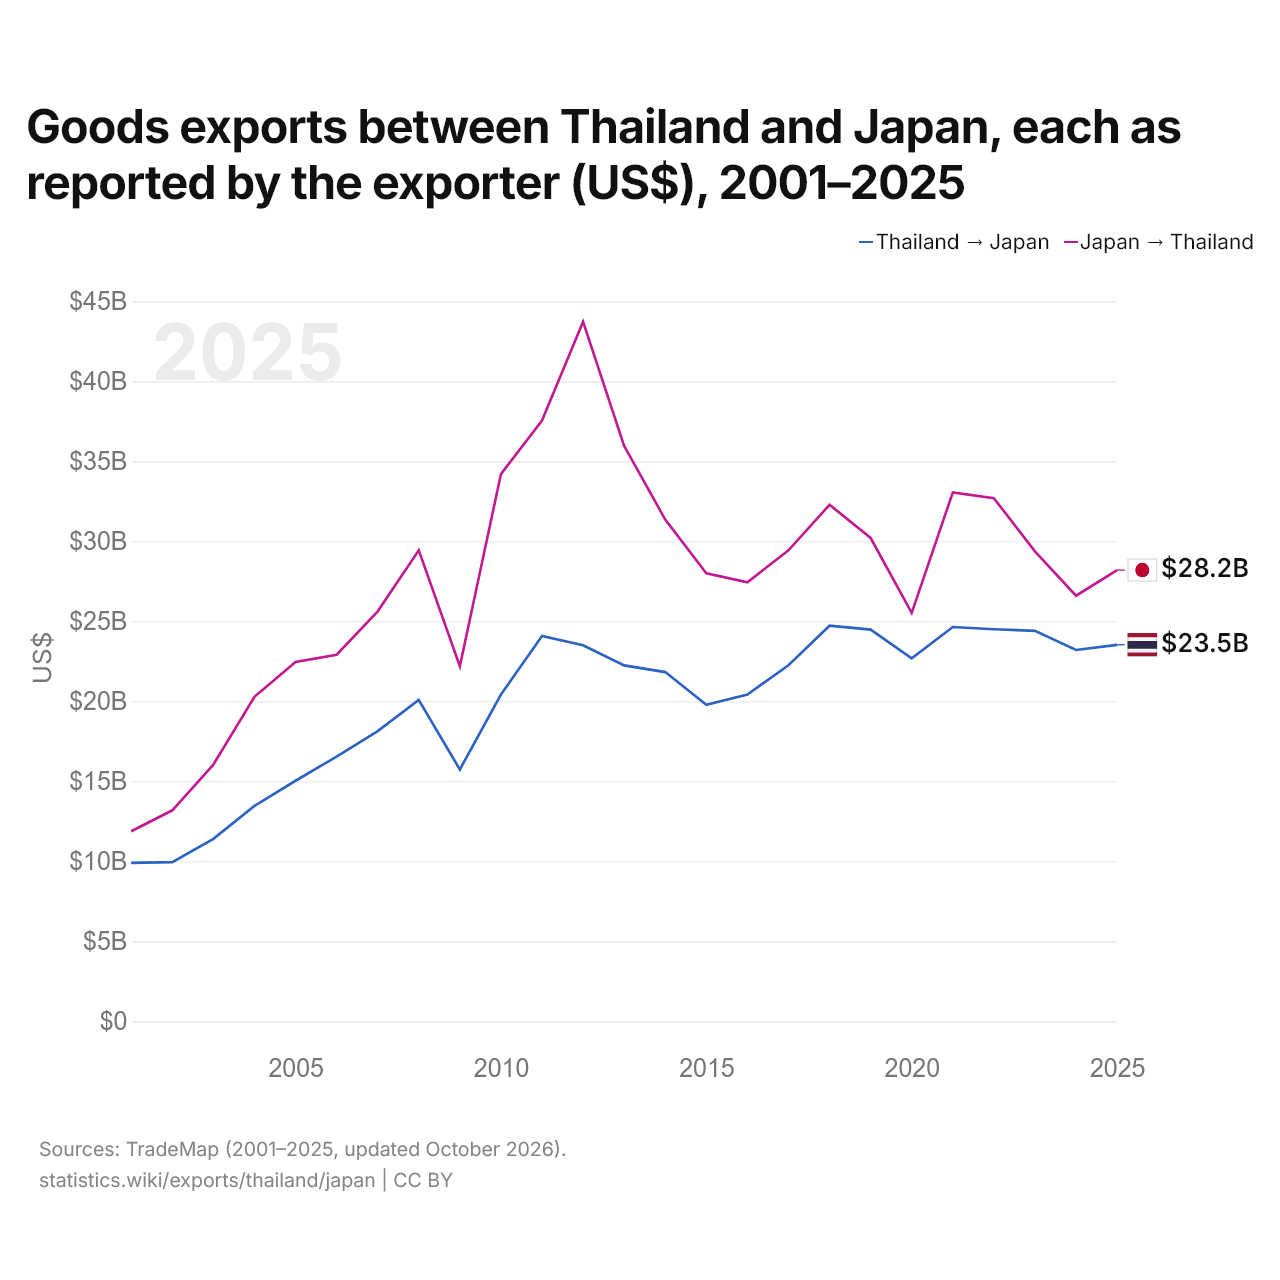
Exportações de bens entre a Tailândia e o Japão, segundo o exportador (US$), 2001–2025
| Ano | US$ | |
|---|---|---|
| Tailândia → Japão | Japão → Tailândia | |
| 2025 | US$ 23.523.293.000 | US$ 28.193.372.000 |
| 2024 | US$ 23.201.163.000 | US$ 26.590.643.000 |
| 2023 | US$ 24.395.559.000 | US$ 29.363.105.000 |
| 2022 | US$ 24.493.028.000 | US$ 32.687.182.000 |
| 2021 | US$ 24.633.451.000 | US$ 33.041.857.000 |
| 2020 | US$ 22.678.467.000 | US$ 25.514.386.000 |
| 2019 | US$ 24.472.836.000 | US$ 30.195.432.000 |
| 2018 | US$ 24.717.571.000 | US$ 32.272.971.000 |
| 2017 | US$ 22.242.302.000 | US$ 29.427.452.000 |
| 2016 | US$ 20.420.004.000 | US$ 27.425.959.000 |
| 2015 | US$ 19.771.635.000 | US$ 27.989.605.000 |
| 2014 | US$ 21.820.597.000 | US$ 31.349.004.000 |
| 2013 | US$ 22.235.592.000 | US$ 35.945.979.000 |
| 2012 | US$ 23.495.120.000 | US$ 43.708.015.000 |
| 2011 | US$ 24.070.267.000 | US$ 37.532.100.000 |
| 2010 | US$ 20.415.711.000 | US$ 34.191.406.000 |
| 2009 | US$ 15.731.838.000 | US$ 22.187.608.000 |
| 2008 | US$ 20.077.626.000 | US$ 29.431.086.000 |
| 2007 | US$ 18.133.187.000 | US$ 25.611.978.000 |
| 2006 | US$ 16.542.485.000 | US$ 22.902.238.000 |
| 2005 | US$ 15.029.432.000 | US$ 22.451.168.000 |
| 2004 | US$ 13.457.061.000 | US$ 20.275.749.000 |
| 2003 | US$ 11.399.102.000 | US$ 16.040.512.000 |
| 2002 | US$ 9.946.776.000 | US$ 13.184.118.000 |
| 2001 | US$ 9.898.256.000 | US$ 11.878.892.000 |
Em 2025, as exportações de bens da Tailândia para o Japão, segundo a Tailândia, foram de US$ 23,5 bilhões, e as do Japão para a Tailândia, segundo o Japão, de US$ 28,2 bilhões: 20% mais do Japão. Em 2001, foram de US$ 9,9 bilhões da Tailândia e de US$ 11,9 bilhões do Japão.
Tailândia vs Japão: dados de exportações
|
Tailândia
|
Japão
|
|
|---|---|---|
| Exportações | US$ 411 bi (2025) | US$ 971 bi (2025) |
| Posição mundial | 24/176 | 9/176 |
| Participação mundial | 1,18% | 2,78% |
| % do PIB | 71,1% | 21,9% |
| Maior categoria de bens | Máquinas, eletrônicos e veículos (49,9%, 2025) | Máquinas, eletrônicos e veículos (59,1%, 2025) |
| Principal destino dos bens | Estados Unidos (21,4%, 2025) | Estados Unidos (18,6%, 2025) |
Comparar as exportações de 2 países quaisquer
Fontes:
- Banco Mundial | Economy & Growth (1960–2025, atualizado em outubro de 2026)
- TradeMap (2001–2025, atualizado em outubro de 2026)
Creative Commons Atribuição (CC BY): você pode copiar, compartilhar, adaptar e reutilizar este conteúdo, inclusive para fins comerciais, desde que cite o statistics.wiki e indique as alterações que fizer. As fontes listadas acima podem ter suas próprias condições de licença.