
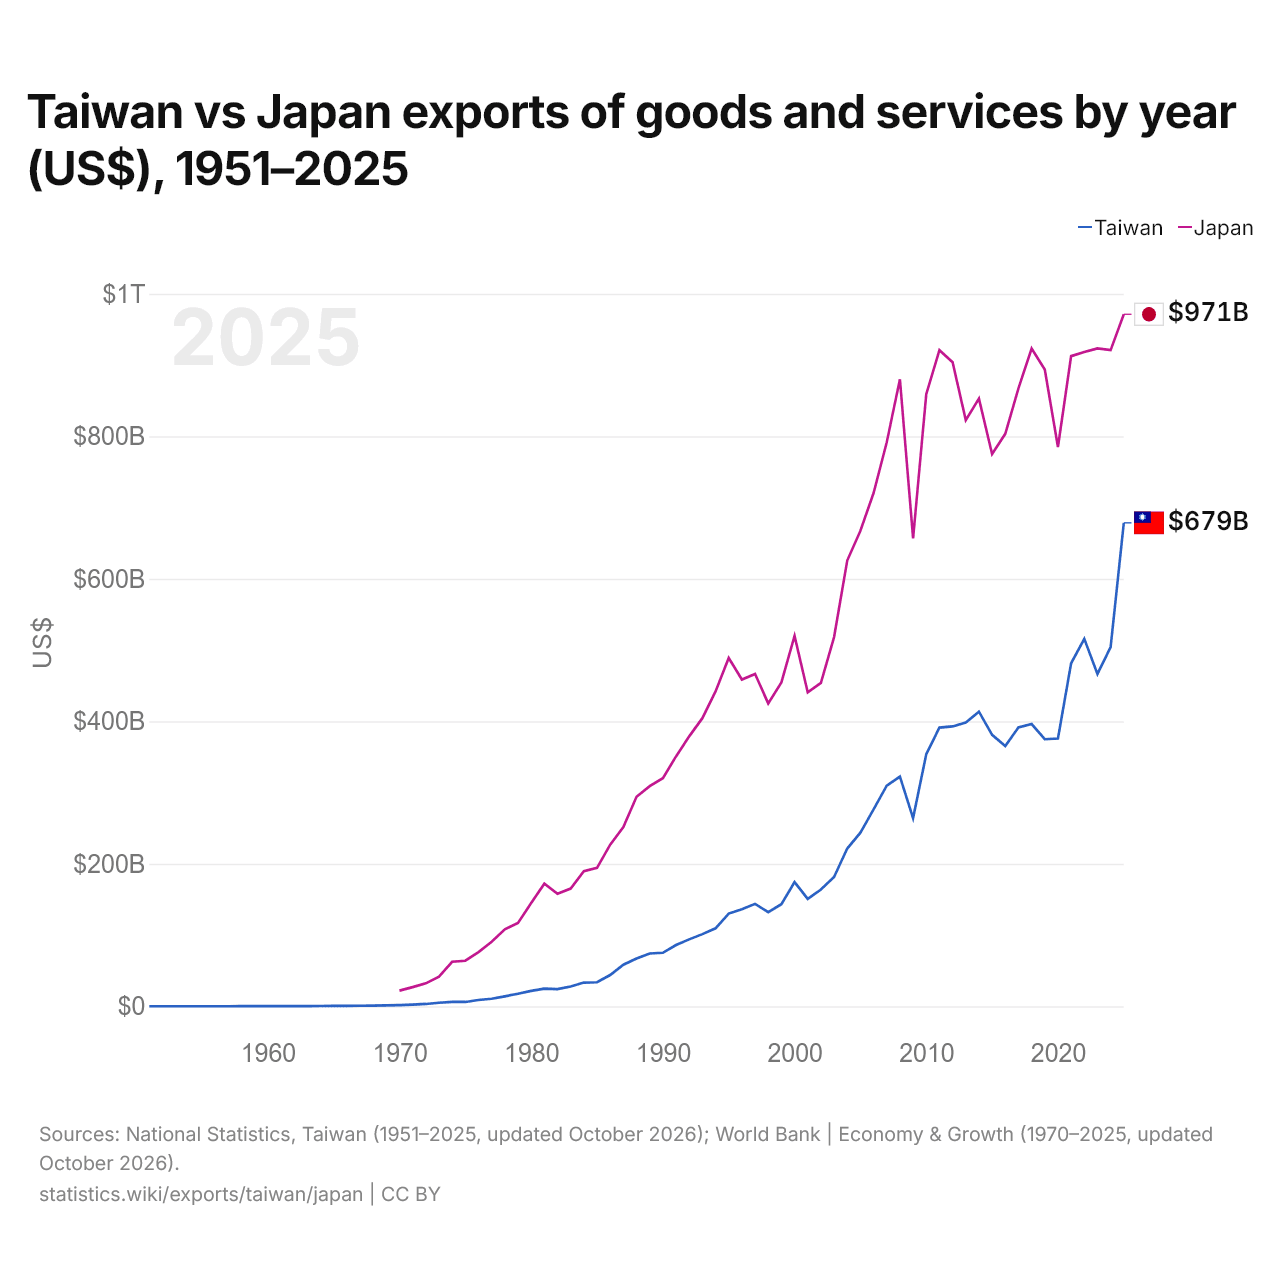
Taiwan vs Japão: exportações de bens e serviços por ano (US$), 1951–2025
1x
| Ano | US$ | |
|---|---|---|
 Taiwan |
 Japão |
|
| 2025 | US$ 678.566.116.350 | US$ 971.285.188.334 |
| 2024 | US$ 504.236.753.419 | US$ 920.960.002.390 |
| 2023 | US$ 466.445.326.327 | US$ 923.420.059.651 |
| 2022 | US$ 515.837.534.989 | US$ 918.412.226.914 |
| 2021 | US$ 481.459.688.595 | US$ 912.551.747.360 |
| 2020 | US$ 375.872.712.567 | US$ 785.057.625.362 |
| 2019 | US$ 374.895.590.744 | US$ 893.761.110.034 |
| 2018 | US$ 396.134.914.653 | US$ 923.192.943.803 |
| 2017 | US$ 391.530.628.346 | US$ 867.373.157.903 |
| 2016 | US$ 365.237.210.862 | US$ 803.470.630.550 |
| 2015 | US$ 380.980.430.904 | US$ 775.031.229.091 |
| 2014 | US$ 413.548.470.902 | US$ 852.957.541.825 |
| 2013 | US$ 398.200.754.692 | US$ 822.673.891.615 |
| 2012 | US$ 392.798.243.520 | US$ 904.081.818.095 |
| 2011 | US$ 391.211.487.294 | US$ 920.847.566.474 |
| 2010 | US$ 353.799.284.890 | US$ 859.110.359.863 |
| 2009 | US$ 264.144.048.543 | US$ 656.874.364.781 |
| 2008 | US$ 322.491.171.216 | US$ 880.075.851.760 |
| 2007 | US$ 309.660.821.223 | US$ 791.701.308.241 |
| 2006 | US$ 276.480.799.188 | US$ 720.411.902.737 |
| 2005 | US$ 243.674.106.867 | US$ 667.445.122.493 |
| 2004 | US$ 221.490.611.569 | US$ 625.631.972.494 |
| 2003 | US$ 181.544.738.333 | US$ 518.203.970.380 |
| 2002 | US$ 163.867.680.036 | US$ 454.066.577.344 |
| 2001 | US$ 150.802.861.162 | US$ 440.830.946.384 |
| 2000 | US$ 174.332.570.553 | US$ 519.863.963.885 |
| 1999 | US$ 143.385.134.964 | US$ 454.583.045.086 |
| 1998 | US$ 132.055.972.754 | US$ 425.156.200.704 |
| 1997 | US$ 143.806.932.753 | US$ 466.482.189.983 |
| 1996 | US$ 136.153.265.352 | US$ 458.650.604.758 |
| 1995 | US$ 130.179.556.061 | US$ 488.922.980.748 |
| 1994 | US$ 109.511.904.439 | US$ 441.885.061.610 |
| 1993 | US$ 101.333.514.601 | US$ 404.418.972.318 |
| 1992 | US$ 93.952.248.951 | US$ 378.894.650.114 |
| 1991 | US$ 86.108.179.742 | US$ 350.804.377.214 |
| 1990 | US$ 75.148.151.148 | US$ 320.186.473.747 |
| 1989 | US$ 74.212.678.516 | US$ 308.916.648.063 |
| 1988 | US$ 67.096.528.450 | US$ 294.106.125.787 |
| 1987 | US$ 58.334.391.897 | US$ 251.700.285.196 |
| 1986 | US$ 43.899.342.867 | US$ 226.865.329.771 |
| 1985 | US$ 33.758.456.455 | US$ 194.351.120.461 |
| 1984 | US$ 33.375.478.442 | US$ 189.758.022.924 |
| 1983 | US$ 27.896.422.863 | US$ 165.329.539.555 |
| 1982 | US$ 24.221.500.550 | US$ 157.933.279.187 |
| 1981 | US$ 24.932.023.178 | US$ 172.134.410.830 |
| 1980 | US$ 21.757.798.498 | US$ 145.104.895.105 |
| 1979 | US$ 17.710.780.314 | US$ 116.997.148.836 |
| 1978 | US$ 14.056.219.616 | US$ 108.052.061.241 |
| 1977 | US$ 10.671.745.438 | US$ 90.568.192.250 |
| 1976 | US$ 8.848.289.208 | US$ 76.182.443.149 |
| 1975 | US$ 6.149.924.118 | US$ 63.986.133.887 |
| 1974 | US$ 6.352.465.974 | US$ 62.536.307.379 |
| 1973 | US$ 5.065.429.671 | US$ 41.576.284.285 |
| 1972 | US$ 3.340.415.716 | US$ 32.270.972.031 |
| 1971 | US$ 2.344.365.150 | US$ 26.966.713.726 |
| 1970 | US$ 1.718.672.282 | US$ 22.026.785.842 |
| 1969 | US$ 1.322.672.272 | - |
| 1968 | US$ 1.031.652.294 | - |
| 1967 | US$ 807.215.291 | - |
| 1966 | US$ 688.092.912 | - |
| 1965 | US$ 544.265.515 | - |
| 1964 | US$ 509.348.690 | - |
| 1963 | US$ 390.872.132 | - |
| 1962 | US$ 262.433.263 | - |
| 1961 | US$ 245.068.108 | - |
| 1960 | US$ 197.741.995 | - |
| 1959 | US$ 180.709.632 | - |
| 1958 | US$ 189.217.196 | - |
| 1957 | US$ 156.906.557 | - |
| 1956 | US$ 125.487.137 | - |
| 1955 | US$ 159.185.094 | - |
| 1954 | US$ 105.082.046 | - |
| 1953 | US$ 127.552.700 | - |
| 1952 | US$ 134.548.307 | - |
| 1951 | US$ 122.059.625 | - |
Em 2025, as exportações de bens e serviços de Taiwan foram de US$ 679 bilhões e as do Japão, de US$ 971 bilhões: as do Japão foram 43% maiores. Em 1970, as exportações do Japão foram 13 vezes maiores: US$ 1,72 bilhão de Taiwan e US$ 22 bilhões do Japão.
As exportações de bens e serviços do Japão têm sido maiores que as de Taiwan todos os anos desde 1970.
Taiwan vs Japão: dados de exportações
|
Taiwan
|
Japão
|
|
|---|---|---|
| Exportações | US$ 679 bi (2025) | US$ 971 bi (2025) |
| Posição mundial | 17/176 | 9/176 |
| Participação mundial | 1,94% | 2,78% |
| % do PIB | 73,6% | 21,9% |
| Maior categoria de bens | n/d | Máquinas, eletrônicos e veículos (59,1%, 2025) |
| Principal destino dos bens | n/d | Estados Unidos (18,6%, 2025) |
Comparar as exportações de 2 países quaisquer
Fontes:
- National Statistics, Taiwan (1951–2025, atualizado em outubro de 2026)
- Banco Mundial | Economy & Growth (1970–2025, atualizado em outubro de 2026)
- TradeMap (2025, atualizado em outubro de 2026)
Creative Commons Atribuição (CC BY): você pode copiar, compartilhar, adaptar e reutilizar este conteúdo, inclusive para fins comerciais, desde que cite o statistics.wiki e indique as alterações que fizer. As fontes listadas acima podem ter suas próprias condições de licença.