
List of countries by population density (2025)
| Rank | Country | Population density, people per mi² | Population | Land area, mi² |
|---|---|---|---|---|
 World |
164.2 | 8,200,694,243 | 49,939,788 | |
| 1 |  Monaco |
47,650 | 38,341 | 0.8 |
| 2 |  Singapore |
21,838 | 6,111,175 | 279.8 |
| 3 |  Vatican |
5,886 (2019) | 1,000 | 0.17 |
| 4 |  Bahrain |
5,181 | 1,600,366 | 309 |
| 5 |  Malta |
4,764 | 579,704 | 121.7 |
| 6 |  Maldives |
4,604 | 529,676 | 115.1 |
| 7 |  Bangladesh |
3,496 | 175,686,899 | 50,259 |
| 8 |  Palestine |
2,327 | 5,413,596 | 2,326 |
| 9 |  Barbados |
1,698 | 282,623 | 166.4 |
| 10 |  Taiwan |
1,664 (2026) | 23,228,408 | 13,960 |
| 11 |  Mauritius |
1,611 | 1,243,741 | 772 |
| 12 |  Rwanda |
1,588 | 14,569,341 | 9,175 |
| 13 |  Nauru |
1,483 | 12,025 | 8.11 |
| 14 |  Lebanon |
1,481 | 5,849,421 | 3,950 |
| 15 |  Burundi |
1,451 | 14,390,003 | 9,915 |
| 16 |  San Marino |
1,443 | 34,109 | 23.6 |
| 17 |  Netherlands |
1,391 | 18,087,633 | 13,000 |
| 18 |  South Korea |
1,372 | 51,684,564 | 37,684 |
| 19 |  India |
1,275 | 1,463,865,525 | 1,147,955 |
| 20 |  Comoros |
1,223 | 882,847 | 722 |
| 21 |  Israel |
1,212 | 10,122,800 | 8,355 |
| 22 |  Haiti |
1,119 | 11,906,095 | 10,641 |
| 23 |  Philippines |
1,014 | 116,786,962 | 115,124 |
| 24 |  Belgium |
1,014 | 11,941,781 | 11,774 |
| 25 |  Tuvalu |
946 | 9,492 | 10 |
| 26 |  Curacao |
912 | 156,263 | 171.4 |
| 27 |  Sri Lanka |
911 | 21,756,000 | 23,884 |
| 28 |  Grenada |
883 | 117,303 | 132.8 |
| 29 |  Japan |
877 | 123,366,734 | 140,734 |
| 30 |  Pakistan |
857 | 255,219,554 | 297,638 |
| 31 |  Vietnam |
840 | 101,598,527 | 121,016 |
| 32 |  Cayman Islands |
818 | 75,844 | 92.7 |
| 33 |  El Salvador |
796 | 6,365,503 | 8,000 |
| 34 |  Saint Lucia |
765 | 180,149 | 235.5 |
| 35 |  United Kingdom |
744 | 69,487,000 | 93,410 |
| 36 |  Gambia |
722 | 2,822,093 | 3,907 |
| 37 |  Kuwait |
707 | 4,865,298 | 6,880 |
| 38 |  Seychelles |
696 | 122,730 | 176.4 |
| 39 |  Luxembourg |
691 | 686,970 | 994 |
| 40 |  Trinidad |
691 | 1,367,764 | 1,980 |
| 41 |  Jamaica |
678 | 2,837,077 | 4,181 |
| 42 |  Nigeria |
675 | 237,527,782 | 351,650 |
| 43 |  Qatar |
670 | 2,972,215 | 4,436 |
| 44 |  Saint Vincent |
665 | 99,924 | 150.2 |
| 45 |  Liechtenstein |
664 | 41,024 | 61.8 |
| 46 |  Uganda |
664 | 51,384,894 | 77,421 |
| 47 |  Sao Tome |
648 | 240,254 | 371 |
| 48 |  Dominican Republic |
619 | 11,520,487 | 18,609 |
| 49 |  Germany |
619 | 83,491,249 | 134,916 |
| 50 |  Malawi |
610 | 22,216,120 | 36,402 |
| 51 |  Switzerland |
596 | 9,092,436 | 15,255 |
| 52 |  North Korea |
572 | 26,571,036 | 46,491 |
| 53 |  Antigua |
554 | 94,209 | 170 |
| 54 |  Nepal |
535 | 29,618,118 | 55,348 |
| 55 |  Marshall Islands |
519 | 36,282 | 69.9 |
| 56 |  Italy |
516 | 58,915,656 | 114,178 |
| 57 |  Saint Kitts |
466 | 46,922 | 100.8 |
| 58 |  Andorra |
459 | 82,904 | 180.7 |
| 59 |  Guatemala |
452 | 18,687,881 | 41,375 |
| 60 |  Kiribati |
436 | 136,488 | 313 |
| 61 |  UAE |
420 | 11,513,149 | 27,421 |
| 62 |  Togo |
409 | 8,591,626 | 21,000 |
| 63 |  Ghana |
399 | 35,064,272 | 87,851 |
| 64 |  Indonesia |
391 | 285,721,236 | 730,664 |
| 65 |  Denmark |
389 | 6,009,169 | 15,444 |
| 66 |  China |
388 | 1,406,585,000 | 3,624,808 |
| 67 |  Cyprus |
384 | 1,370,754 | 3,568 |
| 68 |  Tonga |
373 | 103,742 | 278 |
| 69 |  Czech Republic |
365 | 10,886,878 | 29,790 |
| 70 |  Thailand |
363 | 71,619,863 | 197,256 |
| 71 |  Syria |
361 | 25,620,427 | 70,900 |
| 72 |  Benin |
340 | 14,814,460 | 43,537 |
| 73 |  Cape Verde |
339 | 527,326 | 1,556 |
| 74 |  Jordan |
336 | 11,520,684 | 34,284 |
| 75 |  France |
330 | 68,720,337 | 208,090 |
| 76 |  Azerbaijan |
321 | 10,246,996 | 31,911 |
| 77 |  Sierra Leone |
316 | 8,819,794 | 27,869 |
| 78 |  Ethiopia |
313 | 135,472,051 | 433,259 |
| 79 |  Poland |
308 | 36,435,861 | 118,174 |
| 80 |  Egypt |
308 | 118,365,995 | 384,345 |
| 81 |  Portugal |
305 | 10,804,871 | 35,369 |
| 82 |  Slovakia |
291.6 | 5,413,813 | 18,564 |
| 83 |  Austria |
289 | 9,208,163 | 31,861 |
| 84 |  Turkey |
289 | 85,878,556 | 297,156 |
| 85 |  Malaysia |
283.6 | 35,977,838 | 126,854 |
| 86 |  Armenia |
283.5 | 3,086,700 | 10,888 |
| 87 |  Iraq |
280.5 | 47,020,774 | 167,619 |
| 88 |  Slovenia |
274.1 | 2,130,986 | 7,774 |
| 89 |  Cuba |
272.9 | 10,937,203 | 40,077 |
| 90 |  Hungary |
270 | 9,514,251 | 35,236 |
| 91 |  Ivory Coast |
266.4 | 32,711,547 | 122,780 |
| 92 |  Costa Rica |
264 | 5,152,950 | 19,521 |
| 93 |  Cambodia |
261.9 | 17,847,982 | 68,155 |
| 94 |  Kenya |
256.5 | 57,532,493 | 224,279 |
| 95 |  Spain |
255.8 | 49,355,143 | 192,930 |
| 96 |  Honduras |
254.8 | 11,005,850 | 43,201 |
| 97 |  Senegal |
254.7 | 18,931,966 | 74,336 |
| 98 |  East Timor |
247.1 | 1,418,517 | 5,741 |
| 99 |  Brunei |
229.2 | 466,330 | 2,035 |
| 100 |  Burkina Faso |
227.9 | 24,074,580 | 105,638 |
| 101 |  Dominica |
227.2 | 65,871 | 290 |
| 102 |  Morocco |
223 | 38,430,770 | 172,317 |
| 103 |  Albania |
222.1 | 2,349,580 | 10,579 |
| 104 |  Uzbekistan |
218.9 | 37,053,428 | 169,310 |
| 105 |  Myanmar |
217.7 | 54,850,648 | 251,997 |
| 106 |  Romania |
214.1 | 19,020,271 | 88,834 |
| 107 |  Greece |
209.2 | 10,413,962 | 49,769 |
| 108 |  Guinea-Bissau |
207.2 | 2,249,515 | 10,857 |
| 109 |  Tanzania |
206.7 | 70,545,865 | 341,314 |
| 110 |  Ireland |
206.2 | 5,484,367 | 26,599 |
| 111 |  Tunisia |
205.9 | 12,348,573 | 59,985 |
| 112 |  Yemen |
204.9 | 41,773,878 | 203,850 |
| 113 |  Samoa |
204.3 | 219,306 | 1,073 |
| 114 |  Lesotho |
201.6 | 2,363,325 | 11,722 |
| 115 |  Tajikistan |
201.3 | 10,786,734 | 53,587 |
| 116 |  Serbia |
193.7 | 6,549,143 | 33,818 |
| 117 |  Ecuador |
190.7 | 18,289,896 | 95,892 |
| 118 |  Eswatini |
189.2 | 1,256,174 | 6,641 |
| 119 |  North Macedonia |
187 | 1,820,909 | 9,737 |
| 120 |  Moldova |
185.7 | 2,360,527 | 12,714 |
| 121 |  Croatia |
179.4 | 3,876,200 | 21,606 |
| 122 |  Equatorial Guinea |
179 | 1,938,431 | 10,831 |
| 123 |  Mexico |
175.8 | 131,946,900 | 750,563 |
| 124 |  Ukraine |
174.2 | 38,980,376 | 223,708 |
| 125 |  Afghanistan |
174.1 | 43,844,111 | 251,827 |
| 126 |  Cameroon |
163.7 | 29,879,337 | 182,514 |
| 127 |  Panama |
159.6 | 4,571,189 | 28,641 |
| 128 |  Guinea |
159.2 | 15,099,727 | 94,873 |
| 129 |  Bosnia |
158.8 | 3,140,095 | 19,768 |
| 130 |  Liberia |
154.1 | 5,731,206 | 37,189 |
| 131 |  Bulgaria |
153.5 | 6,433,302 | 41,915 |
| 132 |  Nicaragua |
150.8 | 7,007,502 | 46,464 |
| 133 |  Iran |
147.5 | 92,417,681 | 626,451 |
| 134 |  Georgia |
146.7 | 3,935,766 | 26,830 |
| 135 |  Madagascar |
145.8 | 32,740,678 | 224,634 |
| 136 |  South Africa |
138.2 | 64,747,319 | 468,377 |
| 137 |  Djibouti |
132.3 | 1,184,076 | 8,950 |
| 138 |  Fiji |
131.8 | 933,154 | 7,078 |
| 139 |  DR Congo |
128.9 | 112,832,473 | 875,313 |
| 140 |  Colombia |
124.7 | 53,425,635 | 428,380 |
| 141 |  Montenegro |
120 | 623,129 | 5,193 |
| 142 |  Lithuania |
119.5 | 2,888,774 | 24,166 |
| 143 |  Mozambique |
117.4 | 35,631,653 | 303,623 |
| 144 |  Belarus |
115.9 | 9,085,991 | 78,369 |
| 145 |  Zimbabwe |
113.5 | 16,950,795 | 149,364 |
| 146 |  Bahamas |
104.3 | 403,033 | 3,865 |
| 147 |  Palau |
99.4 | 17,663 | 177.6 |
| 148 |  Kyrgyzstan |
99.2 | 7,343,064 | 74,054 |
| 149 |  United States |
96.8 | 341,784,857 | 3,531,839 |
| 150 |  Laos |
88.3 | 7,873,046 | 89,112 |
| 151 |  Venezuela |
83.7 | 28,516,896 | 340,561 |
| 152 |  Estonia |
82.8 | 1,366,475 | 16,498 |
| 153 |  Somalia |
81.1 | 19,654,739 | 242,217 |
| 154 |  Angola |
81.1 | 39,040,039 | 481,354 |
| 155 |  Solomon Islands |
77.6 | 838,645 | 10,807 |
| 156 |  Eritrea |
77.3 | 3,607,003 | 46,641 |
| 157 |  Latvia |
76.9 | 1,847,785 | 24,027 |
| 158 |  Zambia |
76.3 | 21,913,874 | 287,024 |
| 159 |  Sudan |
71.6 | 51,662,147 | 721,239 |
| 160 |  Vanuatu |
71.2 | 335,169 | 4,706 |
| 161 |  Peru |
70 | 34,576,665 | 494,211 |
| 162 |  Chile |
69.3 | 19,859,921 | 286,500 |
| 163 |  Sweden |
67.4 | 10,596,620 | 157,248 |
| 164 |  Brazil |
65.9 | 212,812,405 | 3,227,096 |
| 165 |  Papua New Guinea |
61.6 | 10,762,817 | 174,850 |
| 166 |  Niger |
57.1 | 27,917,831 | 489,076 |
| 167 |  Bhutan |
54.1 | 796,682 | 14,726 |
| 168 |  Mali |
53.5 | 25,198,821 | 471,118 |
| 169 |  New Zealand |
52.4 | 5,324,700 | 101,665 |
| 170 |  Algeria |
51.6 | 47,435,312 | 919,595 |
| 171 |  Uruguay |
50.1 | 3,384,688 | 67,574 |
| 172 |  South Sudan |
50 | 12,188,788 | 243,990 |
| 173 |  Congo |
49.2 | 6,484,437 | 131,854 |
| 174 |  Finland |
48.1 | 5,646,436 | 117,375 |
| 175 |  Belize |
48 | 422,924 | 8,807 |
| 176 |  Oman |
46 | 5,494,691 | 119,499 |
| 177 |  Paraguay |
45.9 | 7,013,078 | 152,901 |
| 178 |  Saudi Arabia |
44.5 | 36,973,555 | 830,000 |
| 179 |  Argentina |
43.4 | 45,851,378 | 1,056,642 |
| 180 |  Chad |
43.2 | 21,003,705 | 486,180 |
| 181 |  Turkmenistan |
42 | 7,618,847 | 181,441 |
| 182 |  Norway |
39.9 | 5,610,870 | 140,645 |
| 183 |  Bolivia |
30 | 12,581,843 | 420,063 |
| 184 |  Gabon |
26.1 | 2,593,130 | 99,487 |
| 185 |  CAR |
22.9 | 5,513,282 | 240,534 |
| 186 |  Russia |
22.7 | 143,513,328 | 6,323,145 |
| 187 |  Kazakhstan |
20 | 20,843,754 | 1,042,360 |
| 188 |  Mauritania |
13.4 | 5,315,065 | 397,955 |
| 189 |  Canada |
12.3 | 41,651,653 | 3,393,336 |
| 190 |  Botswana |
11.7 | 2,562,122 | 218,816 |
| 191 |  Libya |
11 | 7,458,555 | 679,362 |
| 192 |  Suriname |
10.3 | 639,850 | 61,972 |
| 193 |  Guyana |
10.3 | 835,986 | 81,522 |
| 194 |  Iceland |
10.1 | 392,404 | 38,931 |
| 195 |  Namibia |
9.73 | 3,092,816 | 317,874 |
| 196 |  Australia |
9.3 | 27,614,411 | 2,968,464 |
| 197 |  Mongolia |
5.93 | 3,568,978 | 601,741 |
The list ranks 197 countries by population density in 2025, from Monaco, with 47,650 per mi² (18,398 per km²), to Mongolia, with 5.93 per mi² (2.29 per km²). The world's population density was 164.2 per mi² (63.4 per km²) in 2025: 8.2 billion people on 49,939,788 mi² (129,343,457 km²) of land.
Population density is the number of people per square mile or square kilometer of land: a country's population divided by its land area, which leaves out lakes, rivers and other inland waters. The densities of the world and the regions divide the population of their countries by the land area of the same countries.
The 10 most densely populated countries
The 10 least densely populated countries
Monaco is the most densely populated country, with 47,650 per mi² (18,398 per km²), and Mongolia the least, with 5.93 per mi² (2.29 per km²). Of the ten most densely populated countries, six are in Asia; of the ten least densely populated, four are in Africa.
Population density map of the world, 1961–2025
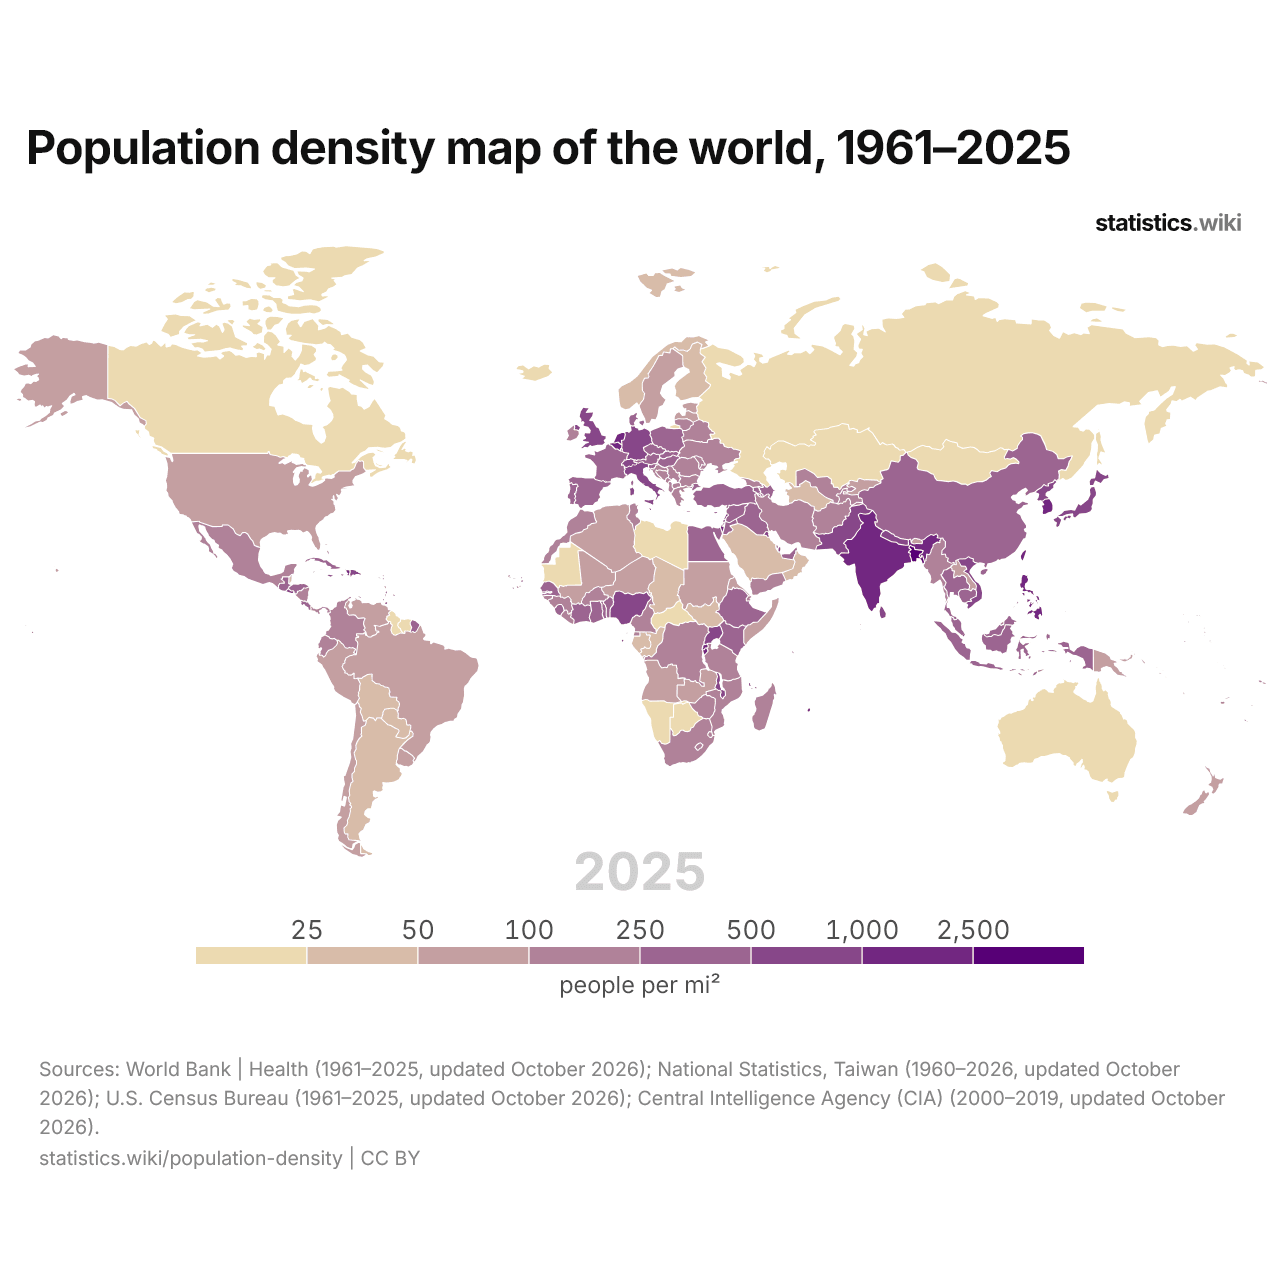
In 2025, 6 countries had more than 2,500 per mi² (965 per km²) and 13 fewer than 25 per mi² (9.65 per km²); in 1961, the numbers were 3 and 41.
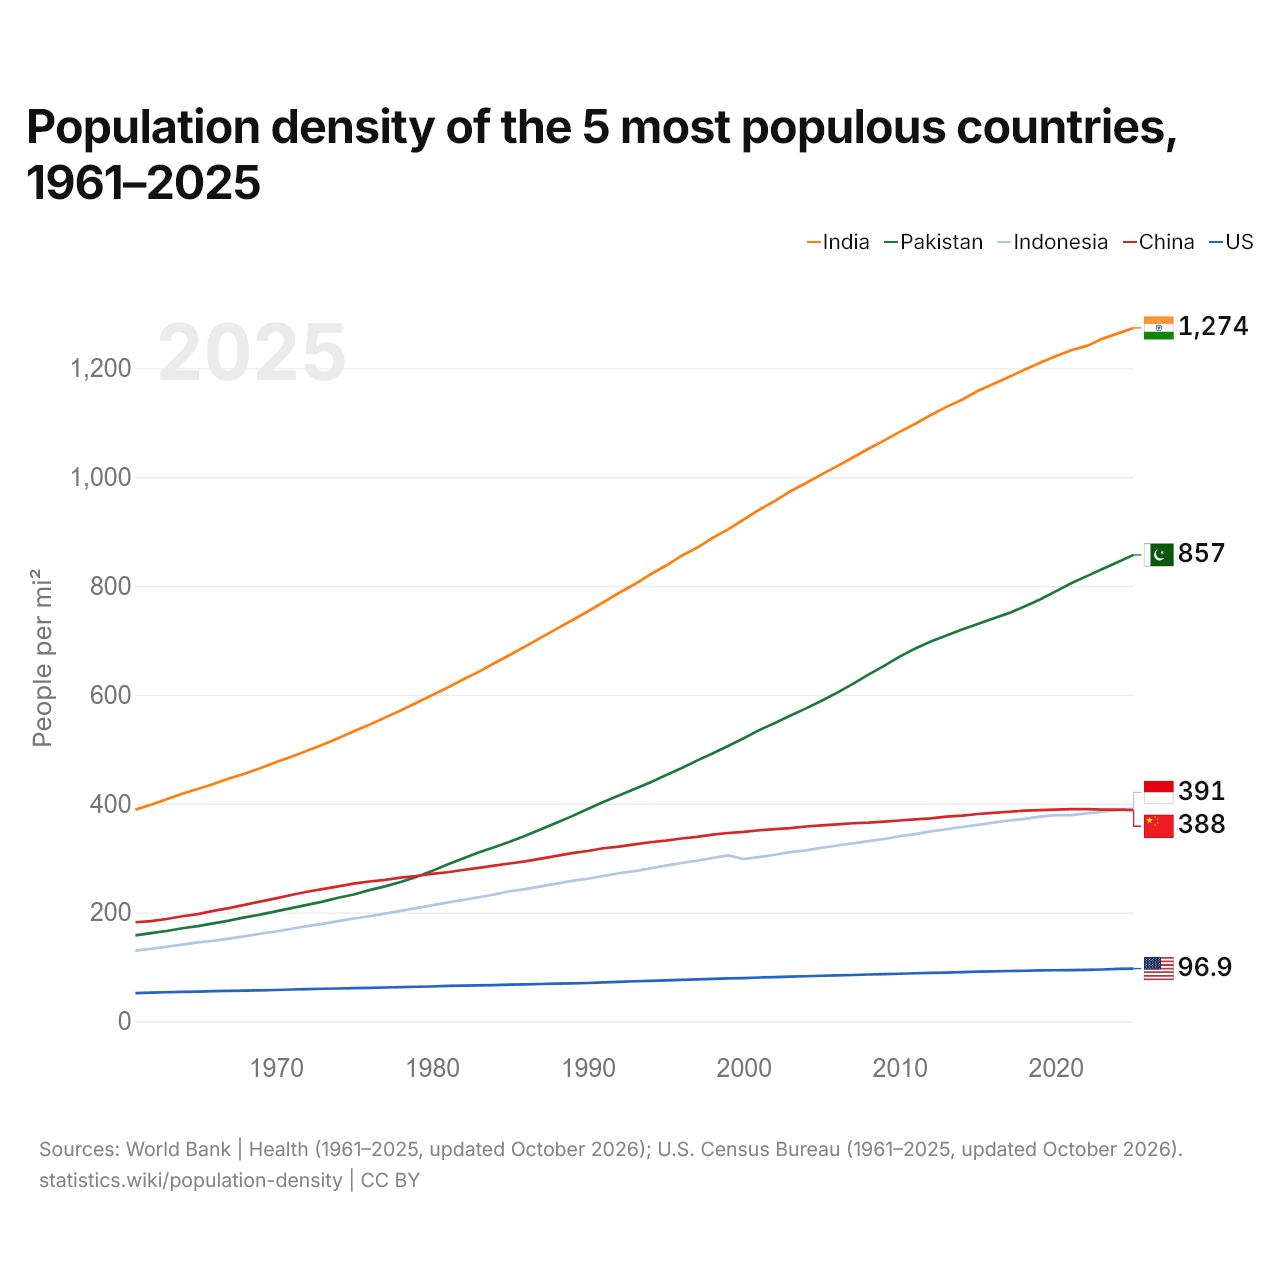
Population density of the 5 most populous countries, 1961–2025
| Year | People per mi² | ||||
|---|---|---|---|---|---|
| India | Pakistan | Indonesia | China | United States | |
| 2025 | 1,274 | 857 | 391 | 388 | 96.9 |
| 2024 | 1,264 | 844 | 388 | 389 | 96.3 |
| 2023 | 1,254 | 831 | 385 | 389 | 95.3 |
| 2022 | 1,241 | 818 | 382 | 390 | 94.5 |
| 2021 | 1,233 | 805 | 379 | 390 | 94 |
| 2020 | 1,222 | 790 | 379 | 389 | 93.8 |
| 2019 | 1,210 | 775 | 376 | 388 | 93.5 |
| 2018 | 1,197 | 762 | 372 | 387 | 93 |
| 2017 | 1,184 | 750 | 369 | 385 | 92.5 |
| 2016 | 1,171 | 740 | 365 | 383 | 91.9 |
| 2015 | 1,158 | 730 | 361 | 381 | 91.2 |
| 2014 | 1,142 | 720 | 357 | 378 | 90.4 |
| 2013 | 1,129 | 709 | 353 | 376 | 89.6 |
| 2012 | 1,114 | 698 | 349 | 373 | 89.1 |
| 2011 | 1,098 | 685 | 344 | 371 | 88.3 |
| 2010 | 1,083 | 670 | 340 | 369 | 87.5 |
| 2009 | 1,067 | 653 | 335 | 367 | 86.8 |
| 2008 | 1,052 | 637 | 331 | 365 | 86 |
| 2007 | 1,036 | 620 | 327 | 364 | 85.2 |
| 2006 | 1,020 | 604 | 323 | 362 | 84.4 |
| 2005 | 1,005 | 589 | 319 | 360 | 83.7 |
| 2004 | 989 | 575 | 314 | 358 | 82.9 |
| 2003 | 974 | 562 | 311 | 355 | 82.1 |
| 2002 | 956 | 548 | 306 | 353 | 81.3 |
| 2001 | 940 | 535 | 302 | 351 | 80.5 |
| 2000 | 922 | 520 | 298 | 348 | 79.5 |
| 1999 | 904 | 506 | 305 | 346 | 79 |
| 1998 | 888 | 492 | 300 | 343 | 78 |
| 1997 | 870 | 479 | 295 | 339 | 77.2 |
| 1996 | 855 | 465 | 291 | 336 | 76.1 |
| 1995 | 837 | 452 | 286 | 332 | 75.4 |
| 1994 | 821 | 439 | 281 | 329 | 74.3 |
| 1993 | 803 | 427 | 276 | 325 | 73.6 |
| 1992 | 787 | 415 | 272 | 321 | 72.5 |
| 1991 | 770 | 403 | 267 | 318 | 71.5 |
| 1990 | 753 | 390 | 262 | 313 | 70.4 |
| 1989 | 737 | 377 | 258 | 309 | 69.7 |
| 1988 | 721 | 365 | 253 | 304 | 69.2 |
| 1987 | 705 | 353 | 248 | 299 | 68.6 |
| 1986 | 689 | 341 | 243 | 294 | 67.9 |
| 1985 | 673 | 330 | 239 | 290 | 67.3 |
| 1984 | 658 | 320 | 233 | 286 | 66.6 |
| 1983 | 642 | 310 | 228 | 282 | 66 |
| 1982 | 628 | 299 | 223 | 278 | 65.5 |
| 1981 | 613 | 288 | 218 | 274 | 65 |
| 1980 | 599 | 276 | 213 | 271 | 64 |
| 1979 | 585 | 265 | 208 | 267 | 63.5 |
| 1978 | 571 | 256 | 203 | 264 | 62.7 |
| 1977 | 558 | 248 | 198 | 260 | 62.2 |
| 1976 | 545 | 241 | 193 | 257 | 61.6 |
| 1975 | 533 | 233 | 189 | 253 | 60.9 |
| 1974 | 520 | 227 | 184 | 248 | 60.3 |
| 1973 | 508 | 220 | 179 | 243 | 59.8 |
| 1972 | 497 | 214 | 175 | 238 | 59.3 |
| 1971 | 486 | 208 | 170 | 232 | 58.5 |
| 1970 | 476 | 202 | 165 | 226 | 57.5 |
| 1969 | 465 | 196 | 161 | 220 | 57 |
| 1968 | 455 | 191 | 156 | 214 | 56.5 |
| 1967 | 446 | 185 | 152 | 208 | 55.9 |
| 1966 | 436 | 180 | 148 | 203 | 55.4 |
| 1965 | 427 | 175 | 145 | 197 | 54.6 |
| 1964 | 418 | 171 | 141 | 193 | 54.1 |
| 1963 | 408 | 166 | 137 | 188 | 53.4 |
| 1962 | 398 | 162 | 133 | 184 | 52.6 |
| 1961 | 389 | 158 | 130 | 182 | 51.8 |
In 2025, India had the highest population density of the five most populous countries, 1,274 per mi² (492 per km²), followed by Pakistan with 857 per mi² (331 per km²), Indonesia with 391 per mi² (151 per km²), China with 388 per mi² (150 per km²) and the United States with 96.9 per mi² (37.4 per km²). India's population density has been the highest of the five every year since 1961.
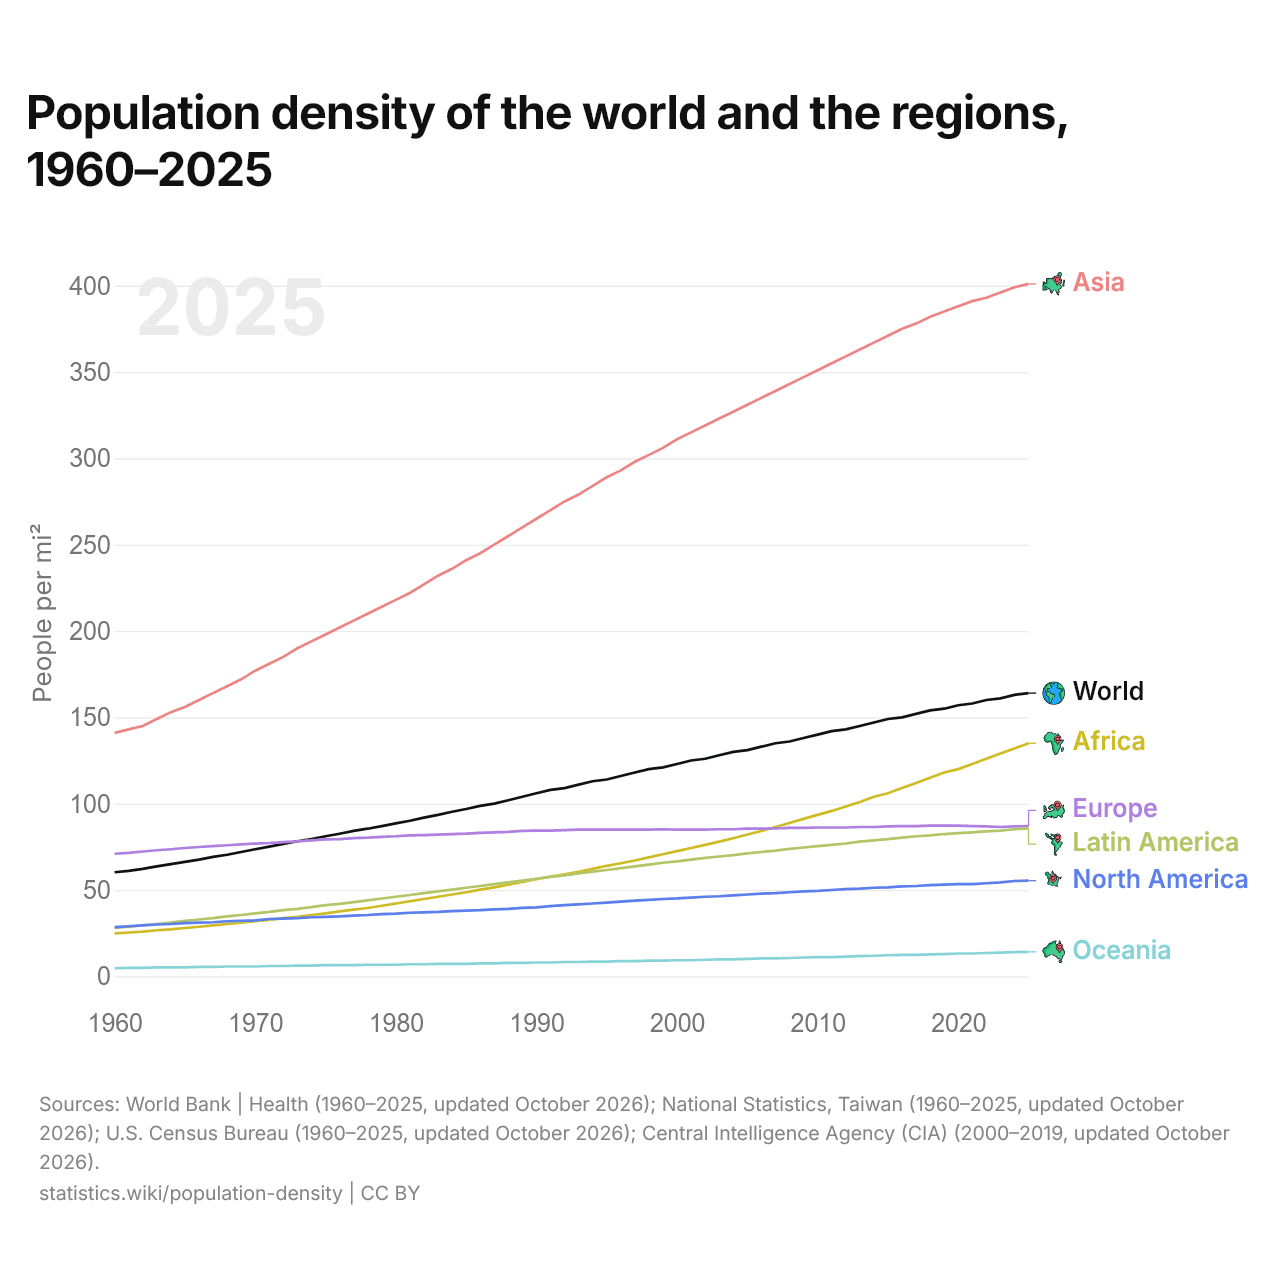
Population density of the world and the regions, 1960–2025
| Year | People per mi² | ||||||
|---|---|---|---|---|---|---|---|
| World | Asia | Africa | Europe | Latin America | North America | Oceania | |
| 2025 | 164 | 401 | 135 | 87 | 85.7 | 55.4 | 14.2 |
| 2024 | 163 | 399 | 132 | 86.8 | 85.2 | 55.2 | 14 |
| 2023 | 161 | 396 | 129 | 86.5 | 84.4 | 54.4 | 13.7 |
| 2022 | 160 | 393 | 126 | 86.8 | 83.9 | 53.9 | 13.5 |
| 2021 | 158 | 391 | 123 | 87 | 83.4 | 53.4 | 13.2 |
| 2020 | 157 | 388 | 120 | 87.3 | 82.9 | 53.4 | 13.2 |
| 2019 | 155 | 385 | 118 | 87.3 | 82.4 | 53.1 | 12.9 |
| 2018 | 154 | 382 | 115 | 87.3 | 81.6 | 52.8 | 12.7 |
| 2017 | 152 | 378 | 112 | 87 | 81.1 | 52.3 | 12.4 |
| 2016 | 150 | 375 | 109 | 87 | 80.3 | 52.1 | 12.4 |
| 2015 | 149 | 371 | 106 | 86.8 | 79.5 | 51.5 | 12.2 |
| 2014 | 147 | 367 | 104 | 86.5 | 78.7 | 51.3 | 11.9 |
| 2013 | 145 | 363 | 101 | 86.5 | 78 | 50.8 | 11.7 |
| 2012 | 143 | 359 | 98.4 | 86.2 | 76.9 | 50.5 | 11.4 |
| 2011 | 142 | 355 | 95.8 | 86.2 | 76.1 | 50 | 11.1 |
| 2010 | 140 | 351 | 93.5 | 86.2 | 75.4 | 49.5 | 11.1 |
| 2009 | 138 | 347 | 91.2 | 86 | 74.6 | 49.2 | 10.9 |
| 2008 | 136 | 343 | 88.8 | 86 | 73.8 | 48.7 | 10.6 |
| 2007 | 135 | 339 | 86.5 | 85.7 | 72.8 | 48.2 | 10.4 |
| 2006 | 133 | 335 | 84.2 | 85.5 | 72 | 47.9 | 10.4 |
| 2005 | 131 | 331 | 82.1 | 85.5 | 71.2 | 47.4 | 10.1 |
| 2004 | 130 | 327 | 80 | 85.2 | 70.2 | 46.9 | 9.84 |
| 2003 | 128 | 323 | 78 | 85.2 | 69.4 | 46.4 | 9.84 |
| 2002 | 126 | 319 | 76.1 | 85 | 68.6 | 46.1 | 9.58 |
| 2001 | 125 | 315 | 74.3 | 85 | 67.6 | 45.6 | 9.32 |
| 2000 | 123 | 311 | 72.5 | 85 | 66.6 | 45.1 | 9.32 |
| 1999 | 121 | 306 | 70.7 | 85.2 | 65.8 | 44.8 | 9.06 |
| 1998 | 120 | 302 | 68.9 | 85 | 64.7 | 44.3 | 9.06 |
| 1997 | 118 | 298 | 67.1 | 85 | 63.7 | 43.8 | 8.81 |
| 1996 | 116 | 293 | 65.5 | 85 | 62.7 | 43.3 | 8.81 |
| 1995 | 114 | 289 | 64 | 85 | 61.6 | 42.7 | 8.55 |
| 1994 | 113 | 284 | 62.2 | 85 | 60.6 | 42.2 | 8.55 |
| 1993 | 111 | 279 | 60.6 | 85 | 59.6 | 41.7 | 8.29 |
| 1992 | 109 | 275 | 59.1 | 84.7 | 58.5 | 41.2 | 8.29 |
| 1991 | 108 | 270 | 57.8 | 84.4 | 57.5 | 40.7 | 8.03 |
| 1990 | 106 | 265 | 56.2 | 84.4 | 56.5 | 39.9 | 8.03 |
| 1989 | 104 | 260 | 54.6 | 84.2 | 55.4 | 39.6 | 7.77 |
| 1988 | 102 | 255 | 53.1 | 83.7 | 54.4 | 39.1 | 7.77 |
| 1987 | 100 | 250 | 51.5 | 83.4 | 53.4 | 38.8 | 7.51 |
| 1986 | 98.7 | 245 | 50.2 | 83.1 | 52.3 | 38.3 | 7.51 |
| 1985 | 96.9 | 241 | 48.7 | 82.6 | 51.3 | 38.1 | 7.25 |
| 1984 | 95.3 | 236 | 47.4 | 82.4 | 50.2 | 37.8 | 7.25 |
| 1983 | 93.5 | 232 | 46.1 | 82.1 | 49.2 | 37.3 | 7.25 |
| 1982 | 91.9 | 227 | 44.8 | 81.8 | 48.2 | 37 | 6.99 |
| 1981 | 90.1 | 222 | 43.5 | 81.6 | 47.1 | 36.8 | 6.99 |
| 1980 | 88.6 | 218 | 42.2 | 81.1 | 46.1 | 36.3 | 6.73 |
| 1979 | 87 | 214 | 40.9 | 80.8 | 45.1 | 36 | 6.73 |
| 1978 | 85.5 | 210 | 39.6 | 80.3 | 44 | 35.5 | 6.73 |
| 1977 | 84.2 | 206 | 38.6 | 80 | 43 | 35.2 | 6.47 |
| 1976 | 82.6 | 202 | 37.6 | 79.5 | 42 | 34.7 | 6.47 |
| 1975 | 81.1 | 198 | 36.5 | 79.3 | 41.2 | 34.4 | 6.47 |
| 1974 | 79.5 | 194 | 35.5 | 78.7 | 40.1 | 34.2 | 6.22 |
| 1973 | 78.2 | 190 | 34.4 | 78.2 | 39.1 | 33.7 | 6.22 |
| 1972 | 76.7 | 185 | 33.7 | 77.7 | 38.3 | 33.4 | 5.96 |
| 1971 | 75.1 | 181 | 32.6 | 77.2 | 37.3 | 33.2 | 5.96 |
| 1970 | 73.6 | 177 | 31.9 | 76.9 | 36.5 | 32.4 | 5.7 |
| 1969 | 72 | 172 | 31.1 | 76.4 | 35.5 | 32.1 | 5.7 |
| 1968 | 70.4 | 168 | 30.3 | 75.9 | 34.7 | 31.9 | 5.7 |
| 1967 | 69.2 | 164 | 29.5 | 75.4 | 33.7 | 31.3 | 5.44 |
| 1966 | 67.6 | 160 | 28.7 | 74.9 | 32.9 | 31.1 | 5.44 |
| 1965 | 66.3 | 156 | 28 | 74.3 | 32.1 | 30.8 | 5.18 |
| 1964 | 65 | 153 | 27.2 | 73.6 | 31.1 | 30.3 | 5.18 |
| 1963 | 63.7 | 149 | 26.7 | 73 | 30.3 | 30 | 5.18 |
| 1962 | 62.2 | 145 | 25.9 | 72.3 | 29.5 | 29.5 | 4.92 |
| 1961 | 61.1 | 143 | 25.4 | 71.5 | 28.7 | 29 | 4.92 |
| 1960 | 60.3 | 141 | 24.9 | 71 | 28 | 28.5 | 4.66 |
In 2025, Asia was the most densely populated region, with 401 per mi² (155 per km²), and Oceania the least, with 14.2 per mi² (5.5 per km²). The world's population density rose from 60.3 per mi² (23.3 per km²) in 1960 to 164 per mi² (63.4 per km²).
Compare the population density of any 2 countries
Sources:
- World Bank | Health (1960–2025, updated October 2026)
- U.S. Census Bureau (1960–2025, updated October 2026)
- National Statistics, Taiwan (1960–2026, updated October 2026)
- Central Intelligence Agency (CIA) (2000–2019, updated October 2026)
Creative Commons Attribution (CC BY): you may copy, share, adapt and reuse this content, also commercially, as long as you credit statistics.wiki and note any changes you made. The sources listed above may have their own license terms.