
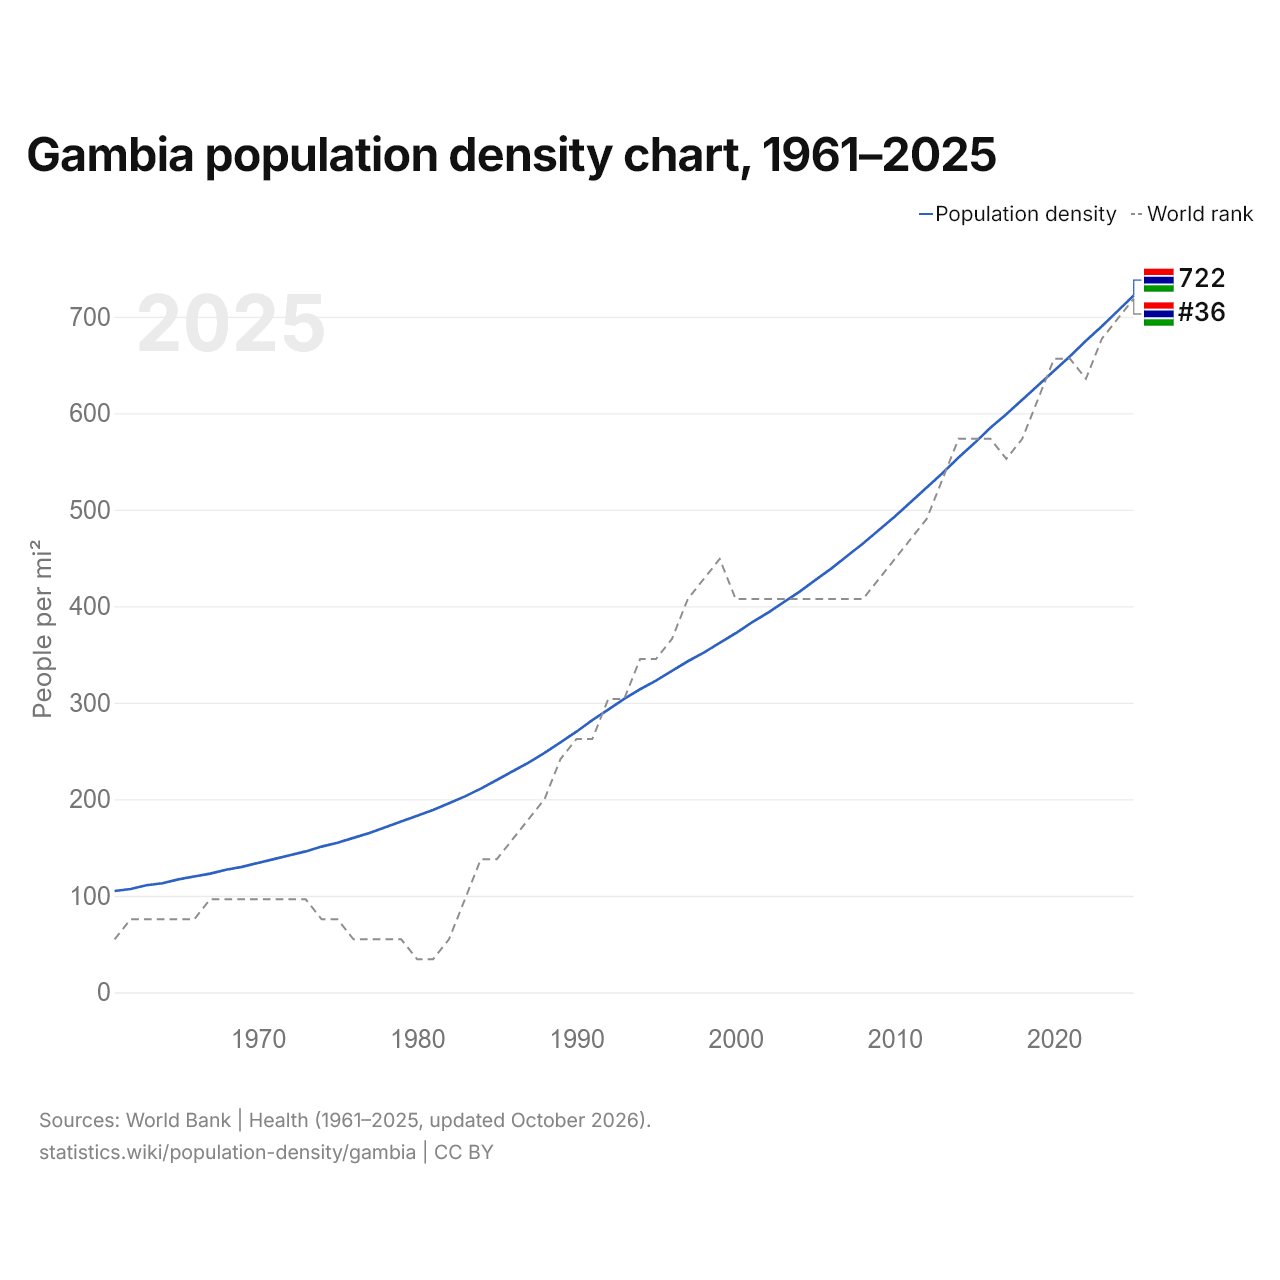
Gambia population density chart, 1961–2025
| Year | People per mi² | World rank |
|---|---|---|
| 2025 | 722 | #36 |
| 2024 | 706 | #37 |
| 2023 | 690 | #38 |
| 2022 | 675 | #40 |
| 2021 | 659 | #39 |
| 2020 | 644 | #39 |
| 2019 | 629 | #41 |
| 2018 | 614 | #43 |
| 2017 | 599 | #44 |
| 2016 | 585 | #43 |
| 2015 | 569 | #43 |
| 2014 | 554 | #43 |
| 2013 | 538 | #45 |
| 2012 | 523 | #47 |
| 2011 | 508 | #48 |
| 2010 | 493 | #49 |
| 2009 | 479 | #50 |
| 2008 | 465 | #51 |
| 2007 | 452 | #51 |
| 2006 | 439 | #51 |
| 2005 | 427 | #51 |
| 2004 | 415 | #51 |
| 2003 | 404 | #51 |
| 2002 | 393 | #51 |
| 2001 | 383 | #51 |
| 2000 | 372 | #51 |
| 1999 | 362 | #49 |
| 1998 | 352 | #50 |
| 1997 | 343 | #51 |
| 1996 | 333 | #53 |
| 1995 | 323 | #54 |
| 1994 | 314 | #54 |
| 1993 | 304 | #56 |
| 1992 | 293 | #56 |
| 1991 | 282 | #58 |
| 1990 | 270 | #58 |
| 1989 | 259 | #59 |
| 1988 | 248 | #61 |
| 1987 | 238 | #62 |
| 1986 | 229 | #63 |
| 1985 | 220 | #64 |
| 1984 | 211 | #64 |
| 1983 | 203 | #66 |
| 1982 | 196 | #68 |
| 1981 | 189 | #69 |
| 1980 | 183 | #69 |
| 1979 | 177 | #68 |
| 1978 | 171 | #68 |
| 1977 | 165 | #68 |
| 1976 | 160 | #68 |
| 1975 | 155 | #67 |
| 1974 | 151 | #67 |
| 1973 | 146 | #66 |
| 1972 | 142 | #66 |
| 1971 | 138 | #66 |
| 1970 | 134 | #66 |
| 1969 | 130 | #66 |
| 1968 | 127 | #66 |
| 1967 | 123 | #66 |
| 1966 | 120 | #67 |
| 1965 | 117 | #67 |
| 1964 | 113 | #67 |
| 1963 | 111 | #67 |
| 1962 | 107 | #67 |
| 1961 | 105 | #68 |
In 2025, the Gambia's population density was 722 per mi² (279 per km²), up from 105 per mi² (40.4 per km²) in 1961. It was the 36th most densely populated country in the world, up from 37th in 2024.
In 2025, the Gambia's population density was the 5th highest of the 54 countries of Africa, where it ranged from Namibia's 9.84 per mi² (3.8 per km²) to Mauritius' 1,611 per mi² (622 per km²). The Gambia's was 4.4 times the world's population density of 164 per mi² (63.4 per km²).
Gambia in the world population density ranking, 2025
| Rank | Country | Population density | Population | Land area | |
|---|---|---|---|---|---|
| 33 |
 El Salvador |
796 per mi² (307 per km²) | 6,365,503 | 8,000 mi² (20,720 km²) | |
| 34 |
 Saint Lucia |
765 per mi² (295.3 per km²) | 180,149 | 235.5 mi² (610 km²) | |
| 35 |
 United Kingdom |
744 per mi² (287.2 per km²) | 69,487,000 | 93,410 mi² (241,930 km²) | |
| 36 |
 Gambia |
722 per mi² (278.9 per km²) | 2,822,093 | 3,907 mi² (10,120 km²) | |
| 37 |
 Kuwait |
707 per mi² (273 per km²) | 4,865,298 | 6,880 mi² (17,820 km²) | |
| 38 |
 Seychelles |
696 per mi² (268.6 per km²) | 122,730 | 176.4 mi² (457 km²) | |
| 39 |
 Luxembourg |
691 per mi² (266.8 per km²) | 686,970 | 994 mi² (2,574 km²) |
Compare the population density of the Gambia with other countries
Sources:
- World Bank | Health (1961–2025, updated October 2026)
- U.S. Census Bureau (2025, updated October 2026)
Creative Commons Attribution (CC BY): you may copy, share, adapt and reuse this content, also commercially, as long as you credit statistics.wiki and note any changes you made. The sources listed above may have their own license terms.