
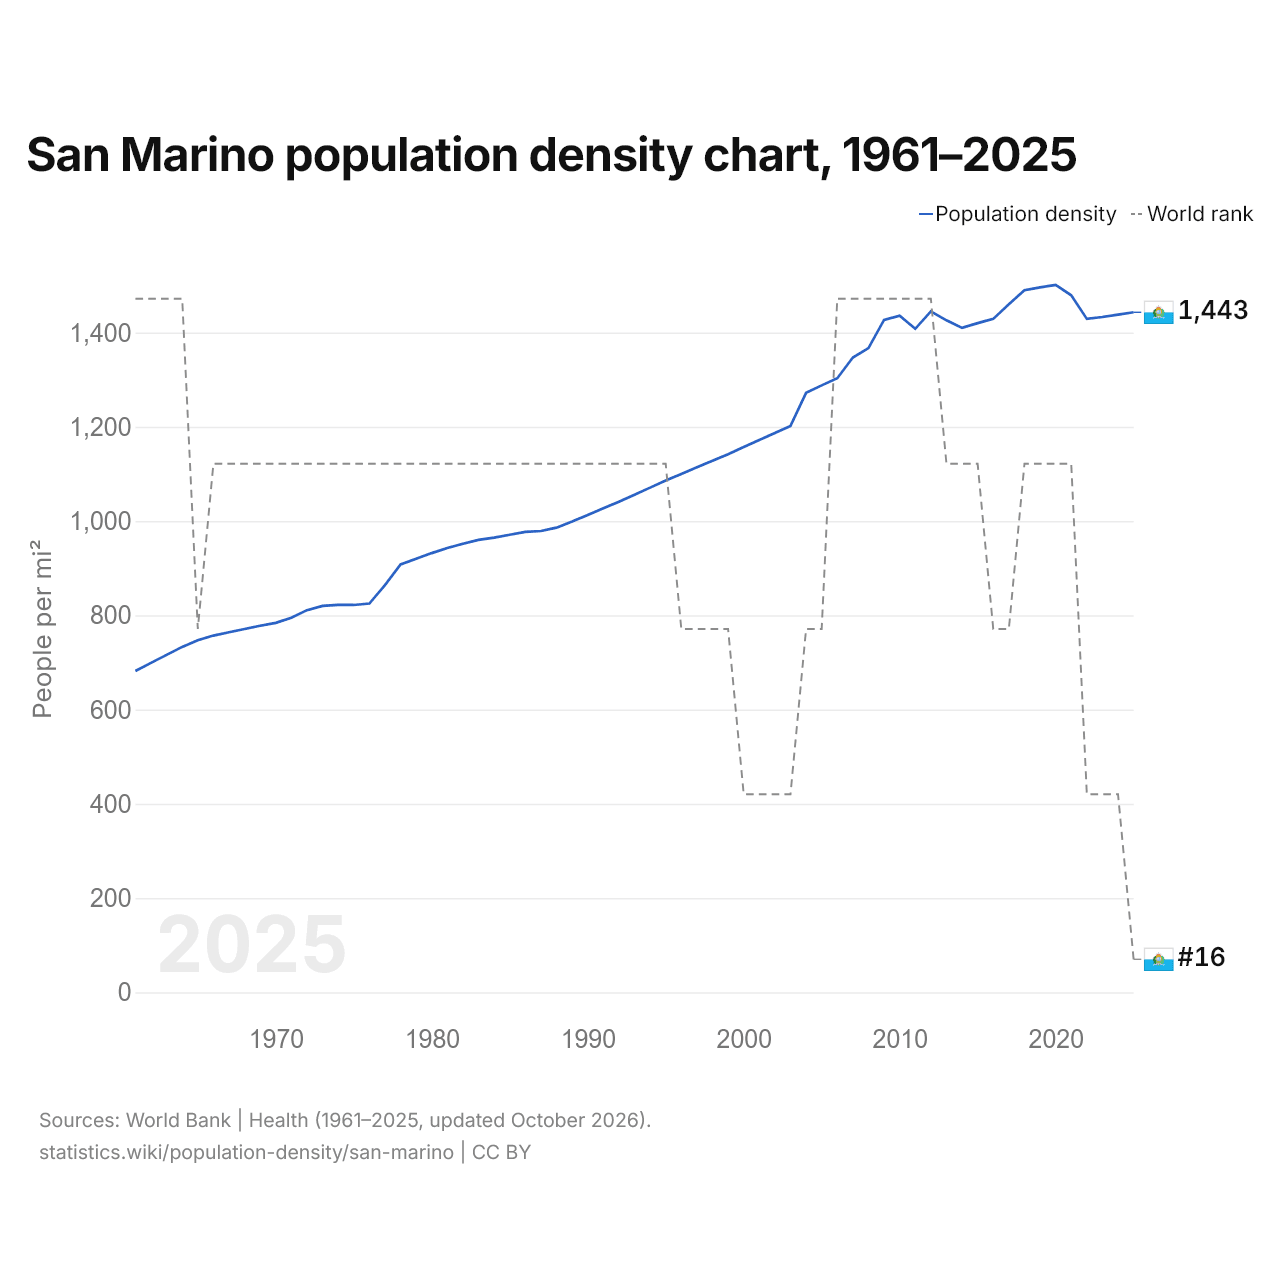
San Marino population density chart, 1961–2025
| Year | People per mi² | World rank |
|---|---|---|
| 2025 | 1,443 | #16 |
| 2024 | 1,438 | #15 |
| 2023 | 1,433 | #15 |
| 2022 | 1,429 | #15 |
| 2021 | 1,479 | #13 |
| 2020 | 1,501 | #13 |
| 2019 | 1,496 | #13 |
| 2018 | 1,490 | #13 |
| 2017 | 1,460 | #14 |
| 2016 | 1,429 | #14 |
| 2015 | 1,420 | #13 |
| 2014 | 1,410 | #13 |
| 2013 | 1,426 | #13 |
| 2012 | 1,445 | #12 |
| 2011 | 1,408 | #12 |
| 2010 | 1,436 | #12 |
| 2009 | 1,427 | #12 |
| 2008 | 1,367 | #12 |
| 2007 | 1,347 | #12 |
| 2006 | 1,303 | #12 |
| 2005 | 1,288 | #14 |
| 2004 | 1,272 | #14 |
| 2003 | 1,202 | #15 |
| 2002 | 1,187 | #15 |
| 2001 | 1,172 | #15 |
| 2000 | 1,157 | #15 |
| 1999 | 1,142 | #14 |
| 1998 | 1,128 | #14 |
| 1997 | 1,114 | #14 |
| 1996 | 1,100 | #14 |
| 1995 | 1,086 | #13 |
| 1994 | 1,071 | #13 |
| 1993 | 1,056 | #13 |
| 1992 | 1,041 | #13 |
| 1991 | 1,027 | #13 |
| 1990 | 1,013 | #13 |
| 1989 | 999 | #13 |
| 1988 | 986 | #13 |
| 1987 | 979 | #13 |
| 1986 | 977 | #13 |
| 1985 | 971 | #13 |
| 1984 | 965 | #13 |
| 1983 | 960 | #13 |
| 1982 | 952 | #13 |
| 1981 | 943 | #13 |
| 1980 | 932 | #13 |
| 1979 | 920 | #13 |
| 1978 | 908 | #13 |
| 1977 | 864 | #13 |
| 1976 | 825 | #13 |
| 1975 | 822 | #13 |
| 1974 | 822 | #13 |
| 1973 | 820 | #13 |
| 1972 | 811 | #13 |
| 1971 | 795 | #13 |
| 1970 | 784 | #13 |
| 1969 | 778 | #13 |
| 1968 | 771 | #13 |
| 1967 | 764 | #13 |
| 1966 | 757 | #13 |
| 1965 | 747 | #14 |
| 1964 | 733 | #12 |
| 1963 | 716 | #12 |
| 1962 | 699 | #12 |
| 1961 | 682 | #12 |
In 2025, San Marino's population density was 1,443 per mi² (557 per km²), up from 682 per mi² (263 per km²) in 1961. It was highest in 2020, at 1,501 per mi² (580 per km²). It was the 16th most densely populated country in the world, down from 15th in 2024. Its highest rank was 12th, last held in 2012.
In 2025, San Marino's population density was the 4th highest of the 45 countries of Europe, where it ranged from Iceland's 10.1 per mi² (3.9 per km²) to Monaco's 47,650 per mi² (18,398 per km²). San Marino's was 8.8 times the world's population density of 164 per mi² (63.4 per km²).
San Marino in the world population density ranking, 2025
| Rank | Country | Population density | Population | Land area | |
|---|---|---|---|---|---|
| 13 |
 Nauru |
1,483 per mi² (573 per km²) | 12,025 | 8.11 mi² (21 km²) | |
| 14 |
 Lebanon |
1,481 per mi² (572 per km²) | 5,849,421 | 3,950 mi² (10,230 km²) | |
| 15 |
 Burundi |
1,451 per mi² (560 per km²) | 14,390,003 | 9,915 mi² (25,680 km²) | |
| 16 |
 San Marino |
1,443 per mi² (557 per km²) | 34,109 | 23.6 mi² (61.2 km²) | |
| 17 |
 Netherlands |
1,391 per mi² (537 per km²) | 18,087,633 | 13,000 mi² (33,670 km²) | |
| 18 |
 South Korea |
1,372 per mi² (530 per km²) | 51,684,564 | 37,684 mi² (97,600 km²) | |
| 19 |
 India |
1,275 per mi² (492 per km²) | 1,463,865,525 | 1,147,955 mi² (2,973,190 km²) |
Compare the population density of San Marino with other countries
Sources:
- World Bank | Health (1961–2025, updated October 2026)
- U.S. Census Bureau (2025, updated October 2026)
Creative Commons Attribution (CC BY): you may copy, share, adapt and reuse this content, also commercially, as long as you credit statistics.wiki and note any changes you made. The sources listed above may have their own license terms.