
Switzerland population density chart, 1961–2025
| Year | People per mi² | World rank |
|---|---|---|
| 2025 | 596 | #51 |
| 2024 | 590 | #51 |
| 2023 | 583 | #50 |
| 2022 | 575 | #51 |
| 2021 | 571 | #49 |
| 2020 | 566 | #50 |
| 2019 | 562 | #49 |
| 2018 | 558 | #49 |
| 2017 | 554 | #50 |
| 2016 | 549 | #50 |
| 2015 | 543 | #47 |
| 2014 | 537 | #46 |
| 2013 | 530 | #46 |
| 2012 | 524 | #46 |
| 2011 | 519 | #46 |
| 2010 | 513 | #44 |
| 2009 | 508 | #44 |
| 2008 | 501 | #44 |
| 2007 | 495 | #44 |
| 2006 | 491 | #44 |
| 2005 | 487 | #44 |
| 2004 | 484 | #44 |
| 2003 | 481 | #43 |
| 2002 | 477 | #42 |
| 2001 | 474 | #42 |
| 2000 | 471 | #42 |
| 1999 | 468 | #40 |
| 1998 | 466 | #40 |
| 1997 | 464 | #40 |
| 1996 | 463 | #40 |
| 1995 | 461 | #39 |
| 1994 | 458 | #39 |
| 1993 | 455 | #39 |
| 1992 | 450 | #39 |
| 1991 | 445 | #39 |
| 1990 | 440 | #38 |
| 1989 | 436 | #37 |
| 1988 | 432 | #37 |
| 1987 | 429 | #37 |
| 1986 | 426 | #37 |
| 1985 | 424 | #36 |
| 1984 | 422 | #36 |
| 1983 | 421 | #37 |
| 1982 | 419 | #37 |
| 1981 | 416 | #36 |
| 1980 | 414 | #36 |
| 1979 | 412 | #34 |
| 1978 | 412 | #33 |
| 1977 | 412 | #32 |
| 1976 | 413 | #32 |
| 1975 | 415 | #30 |
| 1974 | 415 | #30 |
| 1973 | 413 | #30 |
| 1972 | 410 | #30 |
| 1971 | 407 | #30 |
| 1970 | 405 | #30 |
| 1969 | 402 | #30 |
| 1968 | 398 | #29 |
| 1967 | 393 | #29 |
| 1966 | 388 | #29 |
| 1965 | 384 | #29 |
| 1964 | 379 | #30 |
| 1963 | 373 | #30 |
| 1962 | 365 | #30 |
| 1961 | 356 | #30 |
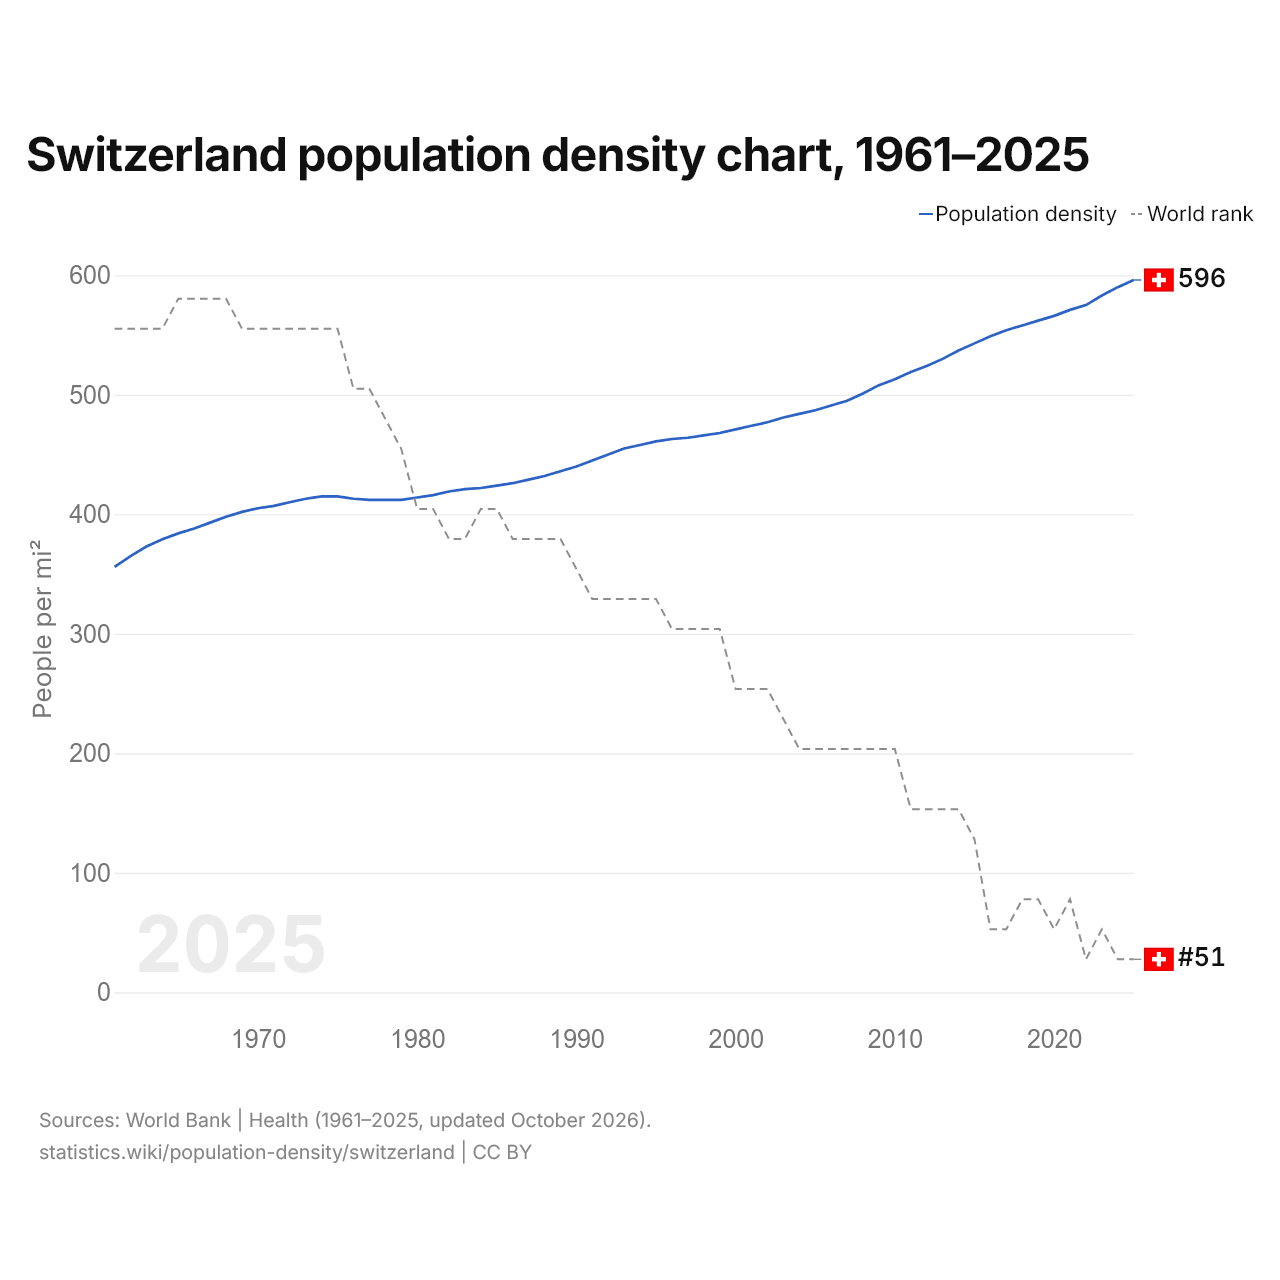
In 2025, Switzerland's population density was 596 per mi² (230 per km²), up from 356 per mi² (138 per km²) in 1961. It was the 51st most densely populated country in the world, a rank it has held since 2024. Its highest rank was 29th, last held in 1968.
In 2025, Switzerland's population density was the 11th highest of the 45 countries of Europe, where it ranged from Iceland's 10.1 per mi² (3.9 per km²) to Monaco's 47,650 per mi² (18,398 per km²). Switzerland's was 3.6 times the world's population density of 164 per mi² (63.4 per km²).
Switzerland in the world population density ranking, 2025
| Rank | Country | Population density | Population | Land area | |
|---|---|---|---|---|---|
| 48 |
 Dominican Republic |
619 per mi² (239 per km²) | 11,520,487 | 18,609 mi² (48,198 km²) | |
| 49 |
 Germany |
619 per mi² (238.9 per km²) | 83,491,249 | 134,916 mi² (349,430 km²) | vs Germany |
| 50 |
 Malawi |
610 per mi² (235.6 per km²) | 22,216,120 | 36,402 mi² (94,280 km²) | |
| 51 |
 Switzerland |
596 per mi² (230.1 per km²) | 9,092,436 | 15,255 mi² (39,510 km²) | |
| 52 |
 North Korea |
572 per mi² (220.7 per km²) | 26,571,036 | 46,491 mi² (120,410 km²) | |
| 53 |
 Antigua |
554 per mi² (214 per km²) | 94,209 | 170 mi² (440 km²) | |
| 54 |
 Nepal |
535 per mi² (206.6 per km²) | 29,618,118 | 55,348 mi² (143,350 km²) | vs Nepal |
Compare the population density of Switzerland with other countries
Sources:
- World Bank | Health (1961–2025, updated October 2026)
- U.S. Census Bureau (2025, updated October 2026)
Creative Commons Attribution (CC BY): you may copy, share, adapt and reuse this content, also commercially, as long as you credit statistics.wiki and note any changes you made. The sources listed above may have their own license terms.