
World agricultural land and arable land, with % of land area
| World agricultural land, 2024 | 17,883,754 mi² |
|---|---|
| World agricultural land, % of land area, 2024 | 35.9% |
| World arable land, 2024 | 5,374,670 mi² |
| World arable land, % of land area, 2024 | 10.8% |
| World arable land per person, 2024 | 0.42 acres per person |
The world has 17,883,754 mi² (46,318,711 km²) of agricultural land, 35.9% of its land area. Of that, 5,374,670 mi² (13,920,331 km²) is arable land, 10.8% of the land area.
Agricultural land is the land used to grow crops and raise livestock, as FAO counts it and the World Bank publishes it: arable land, permanent crops and permanent meadows and pastures. Arable land is under crops sown and harvested within a year, such as cereals, under temporary meadows, market and kitchen gardens, or left fallow for less than five years; permanent crops grow for many years without being replanted, such as coffee, cocoa, fruit trees and vines. The shares divide each area by the country's land area, which leaves out inland waters.
Agricultural land, arable land and permanent crops by country: area and % of land area
| Rank | Country | Agricultural, mi² | Agricultural, % | Permanent crops, mi² |
|---|---|---|---|---|
| 1 |  United States |
1,627,576 | 46.1% | 12,281 |
| 2 |  China |
1,512,837 | 41.7% | 77,770 |
| 3 |  Australia |
1,403,555 | 47.3% | 1,486 |
| 4 |  Brazil |
915,412 | 28.4% | 31,228 |
| 5 |  Russia |
832,869 | 13.2% | 7,765 |
| 6 |  Kazakhstan |
825,425 | 79.2% | 572 |
| 7 |  India |
688,111 | 59.9% | 54,828 |
| 8 |  Saudi Arabia |
677,957 | 81.7% | 1,116 |
| 9 |  Sudan |
435,002 | 60.3% | 834 |
| 10 |  Mongolia |
414,078 | 68.8% | 20.8 |
| 11 |  Mexico |
380,039 | 50.6% | 16,961 |
| 12 |  South Africa |
371,975 | 79.4% | 1,595 |
| 13 |  Argentina |
311,967 | 29.5% | 8,085 |
| 14 |  Nigeria |
271,076 | 77.1% | 30,318 |
| 15 |  Canada |
219,291 | 6.5% | 664 |
| 16 |  Indonesia |
211,406 | 28.9% | 100,619 |
| 17 |  Chad |
194,354 | 40.0% | 144.7 |
| 18 |  Iran |
181,727 | 29.0% | 7,301 |
| 19 |  Niger |
179,996 | 36.8% | 439 |
| 20 |  Angola |
174,848 | 36.3% | 1,379 |
| 21 |  Somalia |
170,387 | 70.3% | 116.4 |
| 22 |  Mozambique |
170,369 | 56.1% | 1,475 |
| 23 |  Mali |
160,909 | 34.2% | 1,269 |
| 24 |  Algeria |
159,538 | 17.3% | 3,792 |
| 25 |  Ukraine |
159,503 | 71.3% | 3,293 |
| 26 |  Madagascar |
158,042 | 70.4% | 2,469 |
| 27 |  Colombia |
156,549 | 36.5% | 9,547 |
| 28 |  Tanzania |
153,966 | 45.1% | 8,487 |
| 29 |  Mauritania |
153,321 | 38.5% | 38.6 |
| 30 |  Turkmenistan |
153,000 | 84.3% | 153.7 |
| 31 |  Bolivia |
151,774 | 36.1% | 987 |
| 32 |  Namibia |
149,854 | 47.1% | 52.2 |
| 33 |  Turkey |
149,190 | 50.2% | 14,668 |
| 34 |  Ethiopia |
148,483 | 34.3% | 7,942 |
| 35 |  Afghanistan |
147,035 | 58.4% | 1,046 |
| 36 |  DR Congo |
141,736 | 16.2% | 7,698 |
| 37 |  Pakistan |
140,499 | 47.2% | 2,699 |
| 38 |  Morocco |
115,831 | 67.2% | 7,461 |
| 39 |  Kenya |
112,226 | 50.0% | 4,164 |
| 40 |  France |
109,817 | 52.8% | 3,922 |
| 41 |  South Sudan |
109,077 | 44.7% | 321 |
| 42 |  Ivory Coast |
102,967 | 83.9% | 32,774 |
| 43 |  Botswana |
99,852 | 45.6% | 7.72 |
| 44 |  Uzbekistan |
99,806 | 58.9% | 1,757 |
| 45 |  Spain |
95,110 | 49.3% | 19,677 |
| 46 |  Peru |
93,817 | 19.0% | 8,804 |
| 47 |  Zambia |
92,049 | 32.1% | 156.3 |
| 48 |  Yemen |
90,549 | 44.4% | 1,202 |
| 49 |  Thailand |
85,346 | 43.3% | 24,190 |
| 50 |  Venezuela |
83,170 | 24.4% | 2,703 |
| 51 |  Paraguay |
82,730 | 54.1% | 318 |
| 52 |  Zimbabwe |
71,780 | 48.1% | 181.9 |
| 53 |  Guinea |
69,470 | 73.2% | 4,719 |
| 54 |  Burkina Faso |
66,104 | 62.6% | 2,628 |
| 55 |  United Kingdom |
64,651 | 69.2% | 166.2 |
| 56 |  Germany |
63,973 | 47.4% | 764 |
| 57 |  Uganda |
62,151 | 80.3% | 10,609 |
| 58 |  Libya |
59,267 | 8.7% | 1,274 |
| 59 |  Uruguay |
59,031 | 87.4% | 150.6 |
| 60 |  Poland |
54,603 | 46.2% | 1,328 |
| 61 |  Syria |
52,560 | 74.1% | 4,050 |
| 62 |  Myanmar |
50,233 | 19.9% | 5,826 |
| 63 |  Italy |
49,813 | 43.6% | 9,261 |
| 64 |  Philippines |
49,211 | 42.7% | 21,836 |
| 65 |  Romania |
48,994 | 55.2% | 1,568 |
| 66 |  Ghana |
48,660 | 55.4% | 10,454 |
| 67 |  Vietnam |
47,456 | 39.2% | 18,998 |
| 68 |  Chile |
41,284 | 14.4% | 1,927 |
| 69 |  Congo |
41,130 | 31.2% | 396 |
| 70 |  Kyrgyzstan |
39,956 | 54.0% | 290.8 |
| 71 |  Cameroon |
38,483 | 21.1% | 6,823 |
| 72 |  New Zealand |
37,425 | 36.8% | 285.7 |
| 73 |  Tunisia |
37,247 | 62.1% | 8,182 |
| 74 |  Senegal |
36,728 | 49.4% | 319 |
| 75 |  Bangladesh |
36,290 | 72.2% | 3,560 |
| 76 |  Iraq |
36,285 | 21.6% | 1,965 |
| 77 |  Malaysia |
31,451 | 24.8% | 27,082 |
| 78 |  Belarus |
30,615 | 39.1% | 302 |
| 79 |  Eritrea |
29,310 | 62.8% | 5.25 |
| 80 |  Cuba |
24,714 | 61.7% | 2,521 |
| 81 |  Malawi |
23,677 | 65.0% | 1,090 |
| 82 |  Cambodia |
23,631 | 34.7% | 1,932 |
| 83 |  CAR |
22,470 | 9.3% | 3,976 |
| 84 |  Nicaragua |
19,656 (2023) | 42.3% (2023) | 1,143 (2023) |
| 85 |  Hungary |
19,562 | 55.5% | 557 |
| 86 |  Ecuador |
19,456 | 20.3% | 5,196 |
| 87 |  Greece |
19,363 | 38.9% | 4,068 |
| 88 |  Bulgaria |
19,359 | 46.2% | 529 |
| 89 |  Guatemala |
19,050 | 46.0% | 4,568 |
| 90 |  Benin |
18,782 | 43.1% | 2,580 |
| 91 |  Azerbaijan |
18,433 | 57.8% | 1,060 |
| 92 |  Japan |
17,691 | 12.6% | 961 |
| 93 |  Ireland |
17,328 | 65.1% | 3.86 |
| 94 |  Egypt |
16,328 | 4.2% | 3,687 |
| 95 |  Sierra Leone |
15,396 | 55.2% | 786 |
| 96 |  Tajikistan |
15,010 | 28.0% | 792 |
| 97 |  Portugal |
14,623 | 41.3% | 3,401 |
| 98 |  Togo |
14,506 | 69.1% | 413 |
| 99 |  Nepal |
14,456 | 26.1% | 560 |
| 100 |  Czech Republic |
13,647 | 45.8% | 156.3 |
| 101 |  Serbia |
12,883 | 38.1% | 817 |
| 102 |  Honduras |
12,308 | 28.5% | 2,729 |
| 103 |  Sri Lanka |
11,649 | 48.8% | 4,653 |
| 104 |  Sweden |
11,487 | 7.3% | 11.6 |
| 105 |  Lithuania |
11,031 | 45.6% | 127.4 |
| 106 |  Lesotho |
10,888 | 92.9% | 23.2 |
| 107 |  Denmark |
10,058 | 65.1% | 108.1 |
| 108 |  North Korea |
10,029 | 21.6% | 975 |
| 109 |  Austria |
9,910 | 31.1% | 246.3 |
| 110 |  Dominican Republic |
9,580 | 51.5% | 1,115 |
| 111 |  Moldova |
9,310 | 73.2% | 861 |
| 112 |  Georgia |
9,044 | 33.7% | 494 |
| 113 |  Finland |
8,715 | 7.4% | 18.9 |
| 114 |  Laos |
8,499 | 9.5% | 1,445 |
| 115 |  Latvia |
7,610 | 31.7% | 38.6 |
| 116 |  Liberia |
7,475 | 20.1% | 822 |
| 117 |  Burundi |
7,358 | 74.2% | 1,182 |
| 118 |  Slovakia |
7,023 | 37.8% | 65.6 |
| 119 |  Netherlands |
6,946 | 53.4% | 135.1 |
| 120 |  Rwanda |
6,942 | 75.7% | 1,974 |
| 121 |  Haiti |
6,931 | 65.1% | 1,159 |
| 122 |  Gabon |
6,844 | 6.9% | 656 |
| 123 |  Panama |
6,610 | 23.1% | 368 |
| 124 |  Djibouti |
6,581 | 73.5% | 3.36 |
| 125 |  Armenia |
6,463 | 59.4% | 238.6 |
| 126 |  Iceland |
6,324 | 16.2% | n/a |
| 127 |  Costa Rica |
6,136 | 31.4% | 1,456 |
| 128 |  South Korea |
6,027 | 16.0% | 784 |
| 129 |  Switzerland |
5,754 | 37.7% | 98 |
| 130 |  Oman |
5,711 | 4.8% | 138.5 |
| 131 |  Croatia |
5,664 | 26.2% | 305 |
| 132 |  Papua New Guinea |
5,425 | 3.1% | 3,417 |
| 133 |  Belgium |
5,228 | 44.4% | 90.1 |
| 134 |  North Macedonia |
4,792 | 49.2% | 150.6 |
| 135 |  Eswatini |
4,623 | 69.6% | 78.7 |
| 136 |  El Salvador |
4,581 | 57.3% | 582 |
| 137 |  Bosnia |
4,434 | 22.4% | 291.2 |
| 138 |  Albania |
4,349 | 41.1% | 338 |
| 139 |  Jordan |
3,965 | 11.6% | 327 |
| 140 |  Norway |
3,799 | 2.7% | 11.6 |
| 141 |  Estonia |
3,792 | 23.0% | 15.4 |
| 142 |  Guinea-Bissau |
3,409 | 31.4% | 906 |
| 143 |  Taiwan |
3,006 (2023) | 21.5% (2023) | 970 (2023) |
| 144 |  Gambia |
2,974 | 76.1% | 102 |
| 145 |  Guyana |
2,780 | 3.4% | 120.3 |
| 146 |  Lebanon |
2,515 | 63.7% | 544 |
| 147 |  Slovenia |
2,360 | 30.4% | 205.3 |
| 148 |  Bhutan |
2,035 | 13.8% | 54.1 |
| 149 |  Israel |
1,988 | 23.8% | 366 |
| 150 |  Jamaica |
1,633 | 39.0% | 266 |
| 151 |  UAE |
1,535 | 5.6% | 159.9 |
| 152 |  Palestine |
1,510 | 64.9% | 275.3 |
| 153 |  East Timor |
1,318 | 23.0% | 308 |
| 154 |  Fiji |
1,203 | 17.0% | 238.6 |
| 155 |  Montenegro |
959 | 18.5% | 36.1 |
| 156 |  Belize |
718 | 8.2% | 123.6 |
| 157 |  Vanuatu |
624 | 13.3% | 385 |
| 158 |  Kuwait |
579 | 8.4% | 23.2 |
| 159 |  Comoros |
570 | 78.9% | 298 |
| 160 |  Luxembourg |
514 | 51.7% | 5.85 |
| 161 |  Cyprus |
484 | 13.6% | 104.2 |
| 162 |  Solomon Islands |
447 | 4.1% | 313 |
| 163 |  Cape Verde |
386 | 24.8% | 9.54 |
| 164 |  Equatorial Guinea |
373 | 3.4% | 149.3 |
| 165 |  Mauritius |
316 | 40.9% | 15.8 |
| 166 |  Suriname |
293.4 | 0.5% | 11.6 |
| 167 |  Qatar |
285.7 | 6.4% | 11.9 |
| 168 |  Trinidad |
229.8 | 11.6% | 90 |
| 169 |  Samoa |
190.8 | 17.8% | 122.4 |
| 170 |  Sao Tome |
170.9 | 46.1% | 151.6 |
| 171 |  Tonga |
134.7 | 48.5% | 35.2 |
| 172 |  Kiribati |
131.3 | 41.9% | 123.6 |
| 173 |  Dominica |
94.6 | 32.6% | 65.6 |
| 174 |  Andorra |
75.6 | 41.9% | 0.04 |
| 175 |  Brunei |
59.1 | 2.9% | 30.5 |
| 176 |  Bahamas |
50.2 | 1.3% | 11.6 |
| 177 |  Barbados |
38.6 | 23.2% | 3.86 |
| 178 |  Saint Lucia |
38.3 | 16.3% | 26.6 |
| 179 |  Antigua |
35.9 | 21.1% | 5.02 |
| 180 |  Bahrain |
31.8 | 10.3% | 8.22 |
| 181 |  Malta |
31 | 25.4% | 4.01 |
| 182 |  Grenada |
30.9 | 23.3% | 15.4 |
| 183 |  Marshall Islands |
28.1 | 40.2% | 26.1 |
| 184 |  Saint Vincent |
27 | 18.0% | 11.6 |
| 185 |  Saint Kitts |
23.2 | 23.0% | 0.39 |
| 186 |  Maldives |
22.8 | 19.8% | 3.86 |
| 187 |  Liechtenstein |
20 | 32.3% | n/a |
| 188 |  Palau |
16.6 | 9.3% | 7.72 |
| 189 |  Cayman Islands |
10.4 | 11.3% | 1.93 |
| 190 |  Tuvalu |
10 | 100.0% | 10 |
| 191 |  San Marino |
10 | 42.3% | 1.21 |
| 192 |  Seychelles |
5.95 | 3.4% | 5.37 |
| 193 |  Singapore |
2.55 | 0.9% | 0.39 |
| 194 |  Nauru |
1.31 | 16.2% | 1.31 |
| Rank | Country | Agricultural, mi² | Arable, mi² | Arable, % | Arable, acres per person |
|---|---|---|---|---|---|
| 1 | United States |
1,627,576 | 585,151 | 16.6% | 1.1 |
| 2 | China |
1,512,837 | 418,788 | 11.6% | 0.19 |
| 3 | Australia |
1,403,555 | 120,715 | 4.1% | 2.84 |
| 4 | Brazil |
915,412 | 214,835 | 6.7% | 0.65 |
| 5 | Russia |
832,869 | 469,689 | 7.4% | 2.09 |
| 6 | Kazakhstan |
825,425 | 117,929 | 11.3% | 3.67 |
| 7 | India |
688,111 | 593,862 | 51.7% | 0.26 |
| 8 | Saudi Arabia |
677,957 | 16,602 | 2.0% | 0.3 |
| 9 | Sudan |
435,002 | 81,062 | 11.2% | 1.03 |
| 10 | Mongolia |
414,078 | 4,337 | 0.7% | 0.79 |
| 11 | Mexico |
380,039 | 77,223 | 10.3% | 0.38 |
| 12 | South Africa |
371,975 | 46,332 | 9.9% | 0.46 |
| 13 | Argentina |
311,967 | 180,858 | 17.1% | 2.53 |
| 14 | Nigeria |
271,076 | 143,568 | 40.8% | 0.39 |
| 15 | Canada |
219,291 | 146,966 | 4.3% | 2.28 |
| 16 | Indonesia |
211,406 | 68,316 | 9.3% | 0.15 |
| 17 | Chad |
194,354 | 20,463 | 4.2% | 0.65 |
| 18 | Iran |
181,727 | 60,614 | 9.7% | 0.42 |
| 19 | Niger |
179,996 | 68,430 | 14.0% | 1.62 |
| 20 | Angola |
174,848 | 17,634 | 3.7% | 0.3 |
| 21 | Somalia |
170,387 | 4,247 | 1.8% | 0.14 |
| 22 | Mozambique |
170,369 | 31,967 | 10.5% | 0.59 |
| 23 | Mali |
160,909 | 25,898 | 5.5% | 0.68 |
| 24 | Algeria |
159,538 | 29,077 | 3.2% | 0.4 |
| 25 | Ukraine |
159,503 | 127,120 | 56.8% | 2.15 |
| 26 | Madagascar |
158,042 | 11,583 | 5.2% | 0.23 |
| 27 | Colombia |
156,549 | 11,368 | 2.7% | 0.14 |
| 28 | Tanzania |
153,966 | 52,903 | 15.5% | 0.49 |
| 29 | Mauritania |
153,321 | 1,737 | 0.4% | 0.22 |
| 30 | Turkmenistan |
153,000 | 6,332 | 3.5% | 0.54 |
| 31 | Bolivia |
151,774 | 23,373 | 5.6% | 1.21 |
| 32 | Namibia |
149,854 | 3,083 | 1.0% | 0.65 |
| 33 | Turkey |
149,190 | 78,085 | 26.3% | 0.58 |
| 34 | Ethiopia |
148,483 | 63,321 | 14.6% | 0.31 |
| 35 | Afghanistan |
147,035 | 30,158 | 12.0% | 0.45 |
| 36 | DR Congo |
141,736 | 63,767 | 7.3% | 0.37 |
| 37 | Pakistan |
140,499 | 118,495 | 39.8% | 0.3 |
| 38 | Morocco |
115,831 | 27,288 | 15.8% | 0.46 |
| 39 | Kenya |
112,226 | 25,822 | 11.5% | 0.29 |
| 40 | France |
109,817 | 65,182 | 31.3% | 0.61 |
| 41 | South Sudan |
109,077 | 9,246 | 3.8% | 0.5 |
| 42 | Ivory Coast |
102,967 | 19,228 | 15.7% | 0.39 |
| 43 | Botswana |
99,852 | 1,004 | 0.5% | 0.25 |
| 44 | Uzbekistan |
99,806 | 15,624 | 9.2% | 0.28 |
| 45 | Spain |
95,110 | 43,955 | 22.8% | 0.58 |
| 46 | Peru |
93,817 | 15,123 | 3.1% | 0.28 |
| 47 | Zambia |
92,049 | 14,672 | 5.1% | 0.44 |
| 48 | Yemen |
90,549 | 4,405 | 2.2% | 0.07 |
| 49 | Thailand |
85,346 | 60,729 | 30.8% | 0.54 |
| 50 | Venezuela |
83,170 | 10,039 | 2.9% | 0.23 |
| 51 | Paraguay |
82,730 | 17,610 | 11.5% | 1.63 |
| 52 | Zimbabwe |
71,780 | 15,523 | 10.4% | 0.6 |
| 53 | Guinea |
69,470 | 23,438 | 24.7% | 1.02 |
| 54 | Burkina Faso |
66,104 | 30,531 | 28.9% | 0.83 |
| 55 | United Kingdom |
64,651 | 23,646 | 25.3% | 0.22 |
| 56 | Germany |
63,973 | 45,004 | 33.4% | 0.34 |
| 57 | Uganda |
62,151 | 33,789 | 43.6% | 0.43 |
| 58 | Libya |
59,267 | 6,641 | 1.0% | 0.58 |
| 59 | Uruguay |
59,031 | 8,375 | 12.4% | 1.58 |
| 60 | Poland |
54,603 | 43,193 | 36.6% | 0.76 |
| 61 | Syria |
52,560 | 16,988 | 24.0% | 0.44 |
| 62 | Myanmar |
50,233 | 42,572 | 16.9% | 0.5 |
| 63 | Italy |
49,813 | 26,831 | 23.5% | 0.29 |
| 64 | Philippines |
49,211 | 21,583 | 18.7% | 0.12 |
| 65 | Romania |
48,994 | 32,358 | 36.4% | 1.09 |
| 66 | Ghana |
48,660 | 18,185 | 20.7% | 0.34 |
| 67 | Vietnam |
47,456 | 25,979 | 21.5% | 0.16 |
| 68 | Chile |
41,284 | 5,444 | 1.9% | 0.18 |
| 69 | Congo |
41,130 | 2,124 | 1.6% | 0.21 |
| 70 | Kyrgyzstan |
39,956 | 4,971 | 6.7% | 0.44 |
| 71 | Cameroon |
38,483 | 23,938 | 13.1% | 0.53 |
| 72 | New Zealand |
37,425 | 2,015 | 2.0% | 0.24 |
| 73 | Tunisia |
37,247 | 10,704 | 17.8% | 0.56 |
| 74 | Senegal |
36,728 | 14,788 | 19.9% | 0.51 |
| 75 | Bangladesh |
36,290 | 30,413 | 60.5% | 0.11 |
| 76 | Iraq |
36,285 | 18,934 | 11.3% | 0.26 |
| 77 | Malaysia |
31,451 | 3,283 | 2.6% | 0.06 |
| 78 | Belarus |
30,615 | 21,314 | 27.2% | 1.49 |
| 79 | Eritrea |
29,310 | 2,664 | 5.7% | 0.48 |
| 80 | Cuba |
24,714 | 11,230 | 28.0% | 0.65 |
| 81 | Malawi |
23,677 | 15,444 | 42.4% | 0.46 |
| 82 | Cambodia |
23,631 | 15,908 | 23.3% | 0.58 |
| 83 | CAR |
22,470 | 6,950 | 2.9% | 0.83 |
| 84 | Nicaragua |
19,656 (2023) | 5,803 (2023) | 12.5% (2023) | 0.54 (2023) |
| 85 | Hungary |
19,562 | 15,940 | 45.2% | 1.07 |
| 86 | Ecuador |
19,456 | 3,588 | 3.7% | 0.13 |
| 87 | Greece |
19,363 | 7,083 | 14.2% | 0.44 |
| 88 | Bulgaria |
19,359 | 13,483 | 32.2% | 1.34 |
| 89 | Guatemala |
19,050 | 7,243 | 17.5% | 0.25 |
| 90 | Benin |
18,782 | 14,078 | 32.3% | 0.62 |
| 91 | Azerbaijan |
18,433 | 8,082 | 25.3% | 0.51 |
| 92 | Japan |
17,691 | 15,533 | 11.0% | 0.08 |
| 93 | Ireland |
17,328 | 1,672 | 6.3% | 0.2 |
| 94 | Egypt |
16,328 | 12,641 | 3.3% | 0.07 |
| 95 | Sierra Leone |
15,396 | 6,116 | 21.9% | 0.45 |
| 96 | Tajikistan |
15,010 | 3,264 | 6.1% | 0.2 |
| 97 | Portugal |
14,623 | 3,299 | 9.3% | 0.2 |
| 98 | Togo |
14,506 | 10,232 | 48.7% | 0.78 |
| 99 | Nepal |
14,456 | 6,965 | 12.6% | 0.15 |
| 100 | Czech Republic |
13,647 | 9,750 | 32.7% | 0.57 |
| 101 | Serbia |
12,883 | 9,810 | 29.0% | 0.95 |
| 102 | Honduras |
12,308 | 3,931 | 9.1% | 0.23 |
| 103 | Sri Lanka |
11,649 | 5,297 | 22.2% | 0.15 |
| 104 | Sweden |
11,487 | 9,722 | 6.2% | 0.59 |
| 105 | Lithuania |
11,031 | 8,865 | 36.7% | 1.96 |
| 106 | Lesotho |
10,888 | 2,228 | 19.0% | 0.61 |
| 107 | Denmark |
10,058 | 9,089 | 58.9% | 0.97 |
| 108 | North Korea |
10,029 | 8,861 | 19.1% | 0.21 |
| 109 | Austria |
9,910 | 5,100 | 16.0% | 0.36 |
| 110 | Dominican Republic |
9,580 | 4,030 | 21.7% | 0.23 |
| 111 | Moldova |
9,310 | 7,170 | 56.4% | 1.91 |
| 112 | Georgia |
9,044 | 1,060 | 3.9% | 0.18 |
| 113 | Finland |
8,715 | 8,649 | 7.4% | 0.98 |
| 114 | Laos |
8,499 | 4,726 | 5.3% | 0.39 |
| 115 | Latvia |
7,610 | 5,236 | 21.8% | 1.8 |
| 116 | Liberia |
7,475 | 1,931 | 5.2% | 0.22 |
| 117 | Burundi |
7,358 | 4,329 | 43.7% | 0.2 |
| 118 | Slovakia |
7,023 | 5,035 | 27.1% | 0.59 |
| 119 | Netherlands |
6,946 | 3,873 | 29.8% | 0.14 |
| 120 | Rwanda |
6,942 | 4,488 | 48.9% | 0.2 |
| 121 | Haiti |
6,931 | 3,880 | 36.5% | 0.21 |
| 122 | Gabon |
6,844 | 1,255 | 1.3% | 0.32 |
| 123 | Panama |
6,610 | 1,923 | 6.7% | 0.27 |
| 124 | Djibouti |
6,581 | 14 | 0.2% | 0.008 |
| 125 | Armenia |
6,463 | 1,705 | 15.7% | 0.36 |
| 126 | Iceland |
6,324 | 467 | 1.2% | 0.77 |
| 127 | Costa Rica |
6,136 | 645 | 3.3% | 0.08 |
| 128 | South Korea |
6,027 | 5,027 | 13.3% | 0.06 |
| 129 | Switzerland |
5,754 | 1,538 | 10.1% | 0.11 |
| 130 | Oman |
5,711 | 360 | 0.3% | 0.04 |
| 131 | Croatia |
5,664 | 3,290 | 15.2% | 0.54 |
| 132 | Papua New Guinea |
5,425 | 1,274 | 0.7% | 0.08 |
| 133 | Belgium |
5,228 | 3,333 | 28.3% | 0.18 |
| 134 | North Macedonia |
4,792 | 1,575 | 16.2% | 0.55 |
| 135 | Eswatini |
4,623 | 683 | 10.3% | 0.35 |
| 136 | El Salvador |
4,581 | 2,784 | 34.8% | 0.28 |
| 137 | Bosnia |
4,434 | 1,587 | 8.0% | 0.32 |
| 138 | Albania |
4,349 | 2,277 | 21.5% | 0.61 |
| 139 | Jordan |
3,965 | 776 | 2.3% | 0.04 |
| 140 | Norway |
3,799 | 3,108 | 2.2% | 0.36 |
| 141 | Estonia |
3,792 | 2,722 | 16.5% | 1.27 |
| 142 | Guinea-Bissau |
3,409 | 1,750 | 16.1% | 0.51 |
| 143 | Taiwan |
3,006 (2023) | n/a | n/a | n/a |
| 144 | Gambia |
2,974 | 2,270 | 58.1% | 0.53 |
| 145 | Guyana |
2,780 | 366 | 0.4% | 0.28 |
| 146 | Lebanon |
2,515 | 426 | 10.8% | 0.05 |
| 147 | Slovenia |
2,360 | 685 | 8.8% | 0.21 |
| 148 | Bhutan |
2,035 | 386 | 2.6% | 0.31 |
| 149 | Israel |
1,988 | 994 | 11.9% | 0.06 |
| 150 | Jamaica |
1,633 | 483 | 11.5% | 0.11 |
| 151 | UAE |
1,535 | 217.2 | 0.8% | 0.01 |
| 152 | Palestine |
1,510 | 161.8 | 7.0% | 0.02 |
| 153 | East Timor |
1,318 | 431 | 7.5% | 0.2 |
| 154 | Fiji |
1,203 | 296.5 | 4.2% | 0.2 |
| 155 | Montenegro |
959 | 37.4 | 0.7% | 0.04 |
| 156 | Belize |
718 | 402 | 4.6% | 0.62 |
| 157 | Vanuatu |
624 | 77.2 | 1.6% | 0.15 |
| 158 | Kuwait |
579 | 30.9 | 0.4% | 0.004 |
| 159 | Comoros |
570 | 213.7 | 29.6% | 0.16 |
| 160 | Luxembourg |
514 | 236.6 | 23.8% | 0.22 |
| 161 | Cyprus |
484 | 372 | 10.4% | 0.18 |
| 162 | Solomon Islands |
447 | 90 | 0.8% | 0.07 |
| 163 | Cape Verde |
386 | 279.7 | 18.0% | 0.34 |
| 164 | Equatorial Guinea |
373 | 204.6 | 1.9% | 0.07 |
| 165 | Mauritius |
316 | 272.7 | 35.3% | 0.14 |
| 166 | Suriname |
293.4 | 212.4 | 0.3% | 0.21 |
| 167 | Qatar |
285.7 | 80.8 | 1.8% | 0.02 |
| 168 | Trinidad |
229.8 | 115.8 | 5.8% | 0.05 |
| 169 | Samoa |
190.8 | 43.6 | 4.1% | 0.13 |
| 170 | Sao Tome |
170.9 | 15.4 | 4.2% | 0.04 |
| 171 | Tonga |
134.7 | 84.1 | 30.3% | 0.52 |
| 172 | Kiribati |
131.3 | 7.72 | 2.5% | 0.04 |
| 173 | Dominica |
94.6 | 21.2 | 7.3% | 0.21 |
| 174 | Andorra |
75.6 | 0.56 | 0.3% | 0.004 |
| 175 | Brunei |
59.1 | 15.4 | 0.8% | 0.02 |
| 176 | Bahamas |
50.2 | 30.9 | 0.8% | 0.05 |
| 177 | Barbados |
38.6 | 27 | 16.2% | 0.06 |
| 178 | Saint Lucia |
38.3 | 10.3 | 4.4% | 0.04 |
| 179 | Antigua |
35.9 | 15.4 | 9.1% | 0.11 |
| 180 | Bahrain |
31.8 | 8.11 | 2.6% | 0.003 |
| 181 | Malta |
31 | 27 | 22.2% | 0.03 |
| 182 | Grenada |
30.9 | 11.6 | 8.7% | 0.06 |
| 183 | Marshall Islands |
28.1 | 1.93 | 2.8% | 0.03 |
| 184 | Saint Vincent |
27 | 7.72 | 5.1% | 0.05 |
| 185 | Saint Kitts |
23.2 | 19.3 | 19.2% | 0.26 |
| 186 | Maldives |
22.8 | 15.1 | 13.1% | 0.02 |
| 187 | Liechtenstein |
20 | 6.68 | 10.8% | 0.11 |
| 188 | Palau |
16.6 | 1.16 | 0.7% | 0.04 |
| 189 | Cayman Islands |
10.4 | 0.77 | 0.8% | 0.007 |
| 190 | Tuvalu |
10 | n/a | n/a | n/a |
| 191 | San Marino |
10 | 4.85 | 20.5% | 0.09 |
| 192 | Seychelles |
5.95 | 0.58 | 0.3% | 0.003 |
| 193 | Singapore |
2.55 | 2.16 | 0.8% | 0.0002 |
| 194 | Nauru |
1.31 | n/a | n/a | n/a |
The list ranks 194 countries by their latest agricultural land, from the United States, which has 1,627,576 mi² (4,215,404 km²), to Nauru, which has 1.31 mi² (3.4 km²).
10 countries with the most arable land
10 countries with the highest share of arable land in land area
10 countries with the lowest share of arable land in land area
India has the most arable land, 593,862 mi² (1,538,097 km²), ahead of the United States, 585,151 mi² (1,515,534 km²). Bangladesh has the largest share of its land area under arable land, 60.5%, and Djibouti the smallest, 0.16%.
Agricultural land by country map, % of land area
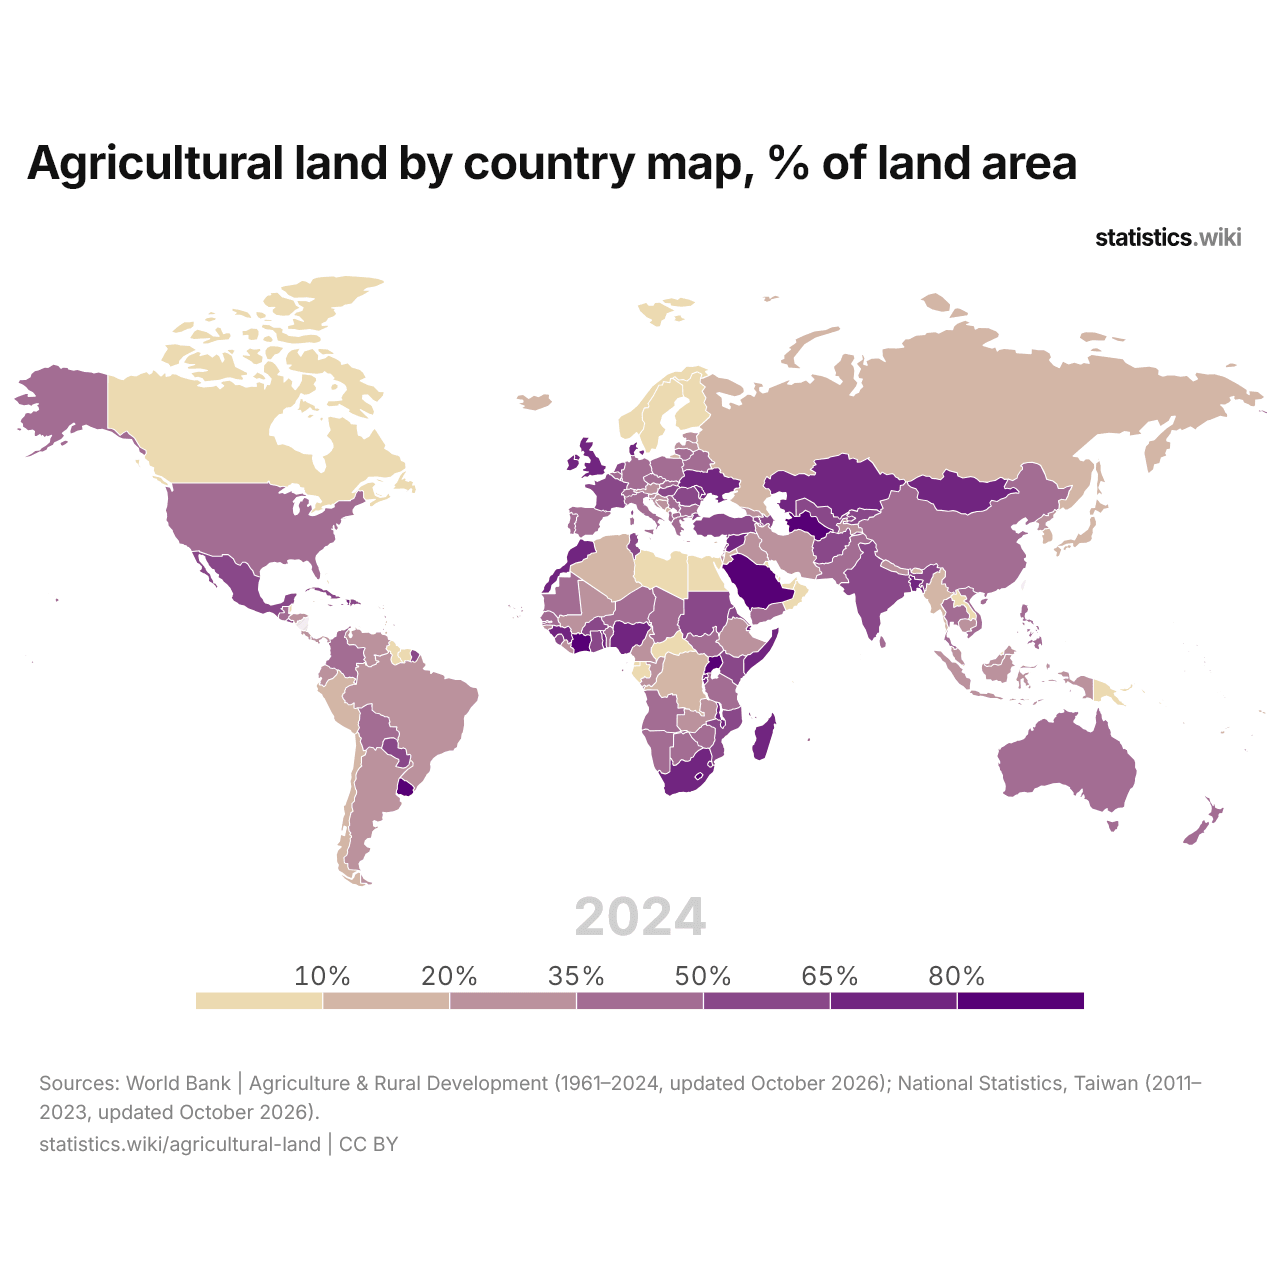
Agricultural land covers more than 65% of the land in 31 countries and less than 10% in 24; in 1961, the numbers were 19 and 23.
The 5 countries with the most agricultural land
| Year | Agricultural land, mi² | ||||
|---|---|---|---|---|---|
| United States | China | Australia | Brazil | Russia | |
| 2024 | 1,627,577 | 1,512,837 | 1,403,555 | 915,412 | 832,869 |
| 2023 | 1,627,577 | 1,512,837 | 1,403,555 | 914,774 | 832,826 |
| 2022 | 1,627,577 | 1,512,999 | 1,403,555 | 914,131 | 832,533 |
| 2021 | 1,631,980 | 1,513,641 | 1,403,555 | 914,224 | 832,537 |
| 2020 | 1,636,384 | 1,509,239 | 1,373,655 | 914,316 | 832,027 |
| 2019 | 1,640,787 | 1,515,034 | 1,399,532 | 914,409 | 832,027 |
| 2018 | 1,645,191 | 1,527,859 | 1,385,701 | 914,501 | 832,027 |
| 2017 | 1,649,594 | 1,540,683 | 1,435,671 | 914,595 | 832,027 |
| 2016 | 1,646,298 | 1,553,511 | 1,322,794 | 911,815 | 832,027 |
| 2015 | 1,643,001 | 1,566,335 | 1,344,095 | 909,031 | 832,027 |
| 2014 | 1,639,704 | 1,579,161 | 1,445,655 | 906,249 | 832,027 |
| 2013 | 1,636,408 | 1,591,986 | 1,435,431 | 903,466 | 832,027 |
| 2012 | 1,633,111 | 1,604,812 | 1,494,509 | 900,683 | 832,027 |
| 2011 | 1,625,299 | 1,617,637 | 1,529,432 | 897,900 | 832,027 |
| 2010 | 1,617,487 | 1,630,463 | 1,453,180 | 895,117 | 832,027 |
| 2009 | 1,609,676 | 1,643,288 | 1,483,625 | 892,334 | 832,027 |
| 2008 | 1,601,864 | 1,650,916 | 1,503,049 | 889,551 | 832,027 |
| 2007 | 1,594,052 | 1,658,544 | 1,538,059 | 886,768 | 831,907 |
| 2006 | 1,594,212 | 1,666,173 | 1,580,324 | 883,985 | 832,004 |
| 2005 | 1,594,371 | 1,673,800 | 1,583,907 | 883,564 | 832,745 |
| 2004 | 1,594,530 | 1,674,164 | 1,524,741 | 883,164 | 833,903 |
| 2003 | 1,594,690 | 1,674,528 | 1,696,919 | 882,763 | 835,050 |
| 2002 | 1,594,849 | 1,674,891 | 1,725,877 | 882,363 | 836,494 |
| 2001 | 1,602,108 | 1,675,255 | 1,759,468 | 881,962 | 837,305 |
| 2000 | 1,600,003 | 1,675,619 | 1,758,576 | 881,562 | 838,467 |
| 1999 | 1,598,027 | 1,678,274 | 1,751,718 | 881,162 | 837,031 |
| 1998 | 1,600,733 | 1,680,930 | 1,791,055 | 880,761 | 838,950 |
| 1997 | 1,601,880 | 1,683,585 | 1,784,692 | 880,361 | 841,660 |
| 1996 | 1,607,366 | 1,686,241 | 1,796,263 | 879,960 | 834,409 |
| 1995 | 1,622,166 | 1,688,747 | 1,789,151 | 879,560 | 835,525 |
| 1994 | 1,626,027 | 1,691,404 | 1,811,371 | 885,026 | 840,587 |
| 1993 | 1,633,011 | 1,694,060 | 1,776,444 | 890,508 | 844,772 |
| 1992 | 1,642,591 | 1,699,419 | 1,799,252 | 895,990 | 855,722 |
| 1991 | 1,648,455 | 1,708,543 | 1,786,811 | 901,472 | - |
| 1990 | 1,648,455 | 1,707,049 | 1,793,201 | 906,954 | - |
| 1989 | 1,648,455 | 1,703,528 | 1,803,499 | 912,436 | - |
| 1988 | 1,648,455 | 1,700,393 | 1,822,603 | 917,918 | - |
| 1987 | 1,648,455 | 1,699,188 | 1,818,618 | 923,400 | - |
| 1986 | 1,665,641 | 1,699,142 | 1,809,047 | 928,881 | - |
| 1985 | 1,665,641 | 1,696,007 | 1,879,511 | 934,362 | - |
| 1984 | 1,665,641 | 1,670,864 | 1,878,611 | 927,047 | - |
| 1983 | 1,665,641 | 1,646,493 | 1,867,920 | 919,724 | - |
| 1982 | 1,665,641 | 1,626,756 | 1,894,881 | 912,400 | - |
| 1981 | 1,653,147 | 1,610,107 | 1,913,387 | 905,077 | - |
| 1980 | 1,653,147 | 1,610,080 | 1,913,669 | 897,754 | - |
| 1979 | 1,653,147 | 1,612,901 | 1,904,403 | 878,548 | - |
| 1978 | 1,653,147 | 1,615,722 | 1,915,453 | 859,548 | - |
| 1977 | 1,661,517 | 1,616,134 | 1,897,731 | 840,548 | - |
| 1976 | 1,660,849 | 1,616,545 | 1,933,376 | 821,548 | - |
| 1975 | 1,660,849 | 1,616,957 | 1,928,762 | 802,548 | - |
| 1974 | 1,660,849 | 1,622,324 | 1,931,889 | 789,007 | - |
| 1973 | 1,669,750 | 1,619,930 | 1,922,391 | 775,471 | - |
| 1972 | 1,678,334 | 1,621,436 | 1,929,797 | 761,934 | - |
| 1971 | 1,687,305 | 1,622,903 | 1,928,720 | 748,397 | - |
| 1970 | 1,696,275 | 1,624,255 | 1,905,154 | 734,861 | - |
| 1969 | 1,681,270 | 1,625,799 | 1,972,550 | 720,525 | - |
| 1968 | 1,682,614 | 1,627,343 | 1,982,903 | 706,212 | - |
| 1967 | 1,680,730 | 1,628,888 | 1,890,281 | 691,899 | - |
| 1966 | 1,681,668 | 1,630,432 | 1,880,428 | 677,586 | - |
| 1965 | 1,682,915 | 1,631,977 | 1,877,457 | 663,273 | - |
| 1964 | 1,695,035 | 1,632,749 | 1,860,641 | 648,961 | - |
| 1963 | 1,704,421 | 1,633,328 | 1,850,856 | 634,648 | - |
| 1962 | 1,714,259 | 1,633,907 | 1,840,135 | 620,335 | - |
| 1961 | 1,727,842 | 1,634,872 | 1,831,995 | 606,022 | - |
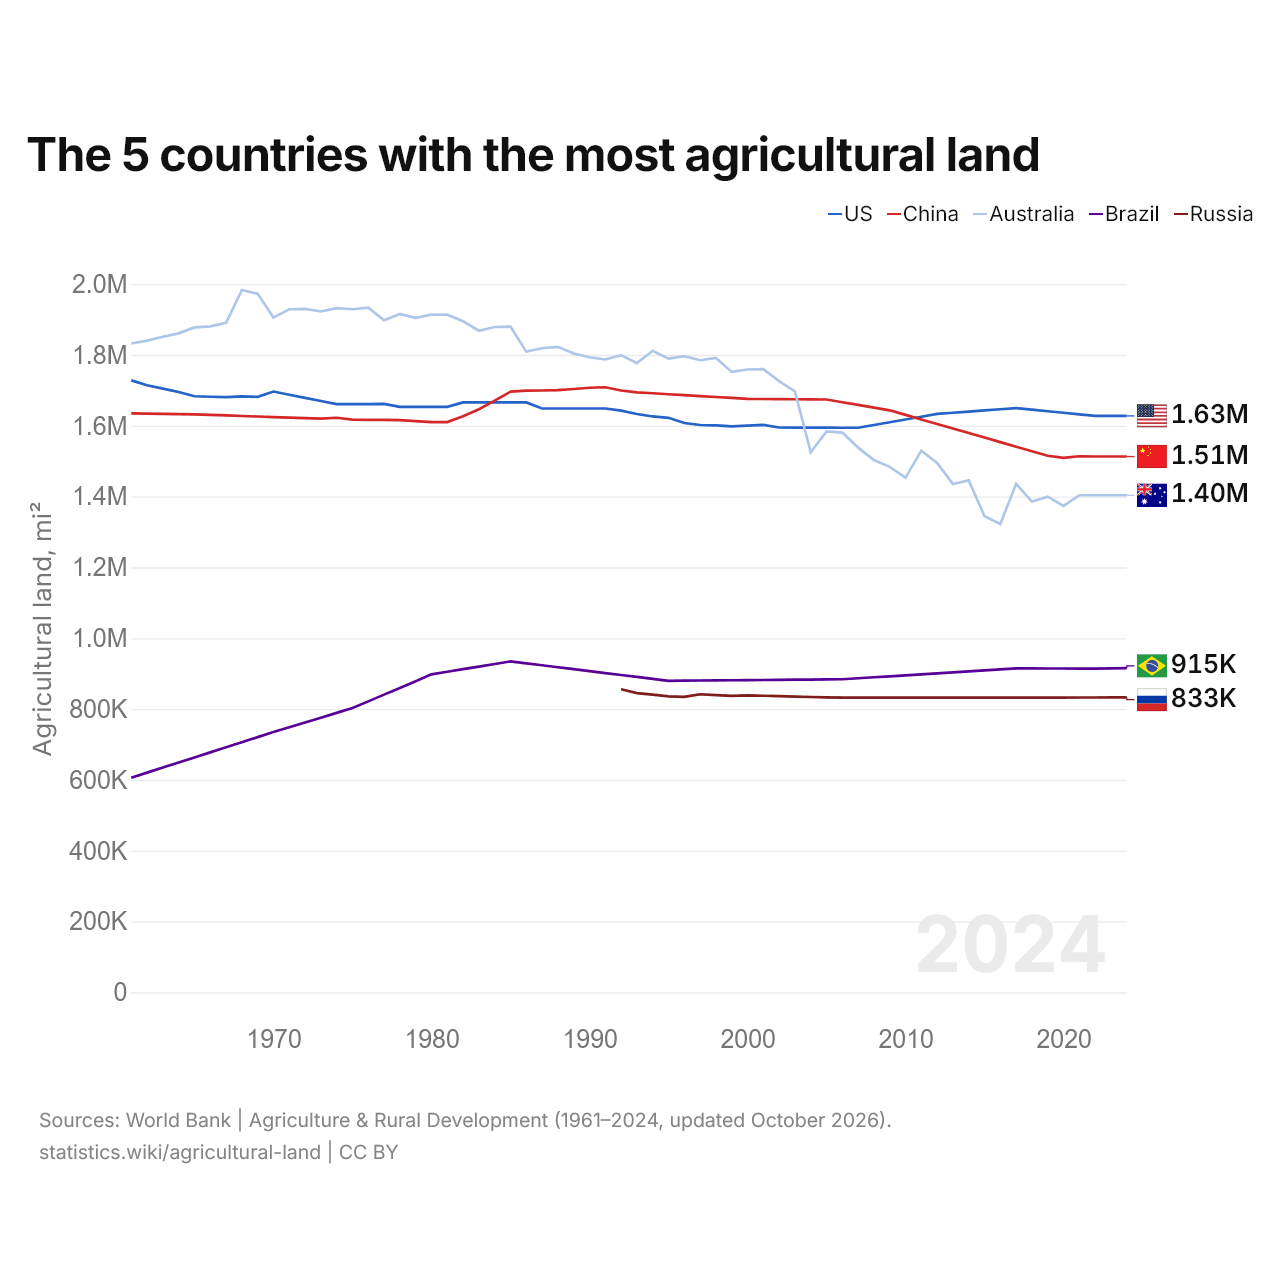
Of all countries, the United States has the most agricultural land, 1,627,577 mi² (4,215,404 km²), followed by China with 1,512,837 mi² (3,918,230 km²), Australia with 1,403,555 mi² (3,635,190 km²), Brazil with 915,412 mi² (2,370,907 km²) and Russia with 832,869 mi² (2,157,120 km²). The United States' agricultural land has been the largest of the five since 2011.
Compare the agricultural land of any 2 countries
Sources:
- World Bank | Agriculture & Rural Development (1961–2024, updated October 2026)
- National Statistics, Taiwan (2011–2023, updated October 2026)
- U.S. Census Bureau (2024, updated October 2026)
Creative Commons Attribution (CC BY): you may copy, share, adapt and reuse this content, also commercially, as long as you credit statistics.wiki and note any changes you made. The sources listed above may have their own license terms.