
Chile: agricultural land, arable land and permanent crops
| Year | Area, mi² | ||
|---|---|---|---|
| Agricultural land | Arable land | Permanent crops | |
| 2024 | 41,284 | 5,444 | 1,927 |
| 2023 | 41,303 | 5,432 | 1,958 |
| 2022 | 41,503 | 5,440 | 2,150 |
| 2021 | 41,769 | 5,788 | 2,067 |
| 2020 | 42,742 | 5,309 | 2,078 |
| 2019 | 44,270 | 5,402 | 2,070 |
| 2018 | 45,902 | 5,617 | 2,044 |
| 2017 | 47,505 | 5,804 | 2,019 |
| 2016 | 48,796 | 5,678 | 1,993 |
| 2015 | 50,301 | 5,766 | 1,968 |
| 2014 | 51,547 | 5,595 | 1,942 |
| 2013 | 52,961 | 5,593 | 1,917 |
| 2012 | 54,199 | 5,414 | 1,892 |
| 2011 | 55,668 | 5,466 | 1,866 |
| 2010 | 56,828 | 5,210 | 1,841 |
| 2009 | 58,317 | 5,281 | 1,815 |
| 2008 | 59,529 | 5,077 | 1,790 |
| 2007 | 60,742 | 4,873 | 1,764 |
| 2006 | 60,466 | 5,180 | 1,703 |
| 2005 | 60,189 | 5,488 | 1,642 |
| 2004 | 59,913 | 5,795 | 1,582 |
| 2003 | 59,638 | 6,103 | 1,521 |
| 2002 | 59,362 | 6,410 | 1,460 |
| 2001 | 59,086 | 6,718 | 1,399 |
| 2000 | 58,810 | 7,026 | 1,338 |
| 1999 | 58,533 | 7,333 | 1,277 |
| 1998 | 58,761 | 7,641 | 1,216 |
| 1997 | 58,772 | 7,653 | 1,216 |
| 1996 | 58,811 | 7,664 | 1,216 |
| 1995 | 59,189 | 8,185 | 1,137 |
| 1994 | 59,653 | 8,788 | 1,058 |
| 1993 | 59,757 | 8,896 | 1,054 |
| 1992 | 60,062 | 9,421 | 1,027 |
| 1991 | 60,962 | 10,367 | 981 |
| 1990 | 61,386 | 10,819 | 954 |
| 1989 | 62,429 | 11,853 | 961 |
| 1988 | 62,371 | 11,811 | 946 |
| 1987 | 62,406 | 11,877 | 915 |
| 1986 | 63,460 | 12,950 | 896 |
| 1985 | 63,599 | 13,297 | 880 |
| 1984 | 63,707 | 13,417 | 869 |
| 1983 | 63,900 | 13,622 | 857 |
| 1982 | 64,093 | 13,822 | 849 |
| 1981 | 64,672 | 14,413 | 838 |
| 1980 | 65,058 | 14,811 | 826 |
| 1979 | 65,251 | 15,016 | 815 |
| 1978 | 65,637 | 15,413 | 803 |
| 1977 | 66,023 | 15,811 | 792 |
| 1976 | 66,410 | 16,209 | 780 |
| 1975 | 63,900 | 16,031 | 764 |
| 1974 | 62,742 | 16,031 | 764 |
| 1973 | 61,151 | 15,838 | 764 |
| 1972 | 60,232 | 15,452 | 764 |
| 1971 | 59,267 | 15,259 | 764 |
| 1970 | 58,301 | 15,066 | 764 |
| 1969 | 57,328 | 14,672 | 764 |
| 1968 | 56,672 | 14,595 | 764 |
| 1967 | 55,823 | 14,517 | 764 |
| 1966 | 54,973 | 14,440 | 764 |
| 1965 | 54,321 | 14,363 | 764 |
| 1964 | 53,660 | 14,286 | 764 |
| 1963 | 52,996 | 14,209 | 757 |
| 1962 | 52,340 | 14,131 | 757 |
| 1961 | 51,684 | 14,054 | 757 |
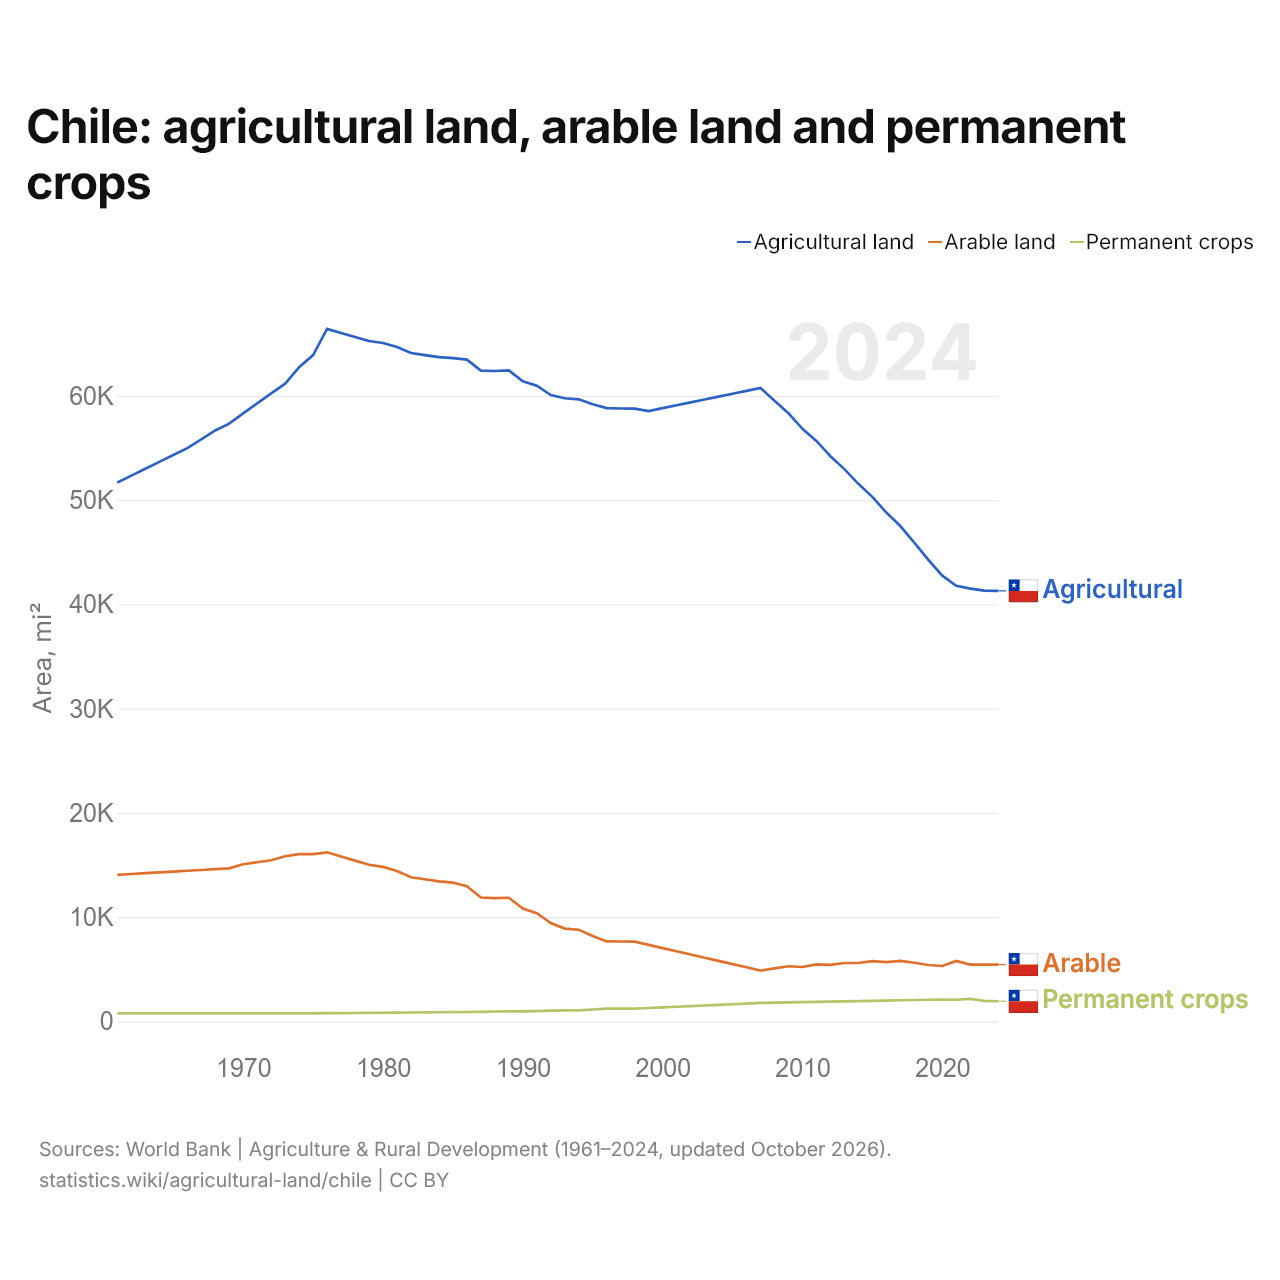
Agricultural land in Chile covers 41,284 mi² (106,925 km²), down from 51,684 mi² (133,860 km²) in 1961. Its agricultural land was largest in 1976, at 66,410 mi² (172,000 km²). Arable land covers 5,444 mi² (14,099 km²) and permanent crops 1,927 mi² (4,990 km²).
Chile's agricultural land is the 10th largest of 34 countries in Latin America, and 1.7% of the region's total. Chile's arable land has shrunk by 61% since 1961, when it covered 14,054 mi² (36,400 km²). Agriculture made up 3.5% of Chile's GDP in 2025.
Chile agricultural land by use
| Area, mi² | % of land area | World rank | |
|---|---|---|---|
| Agricultural land | 41,284 | 14.4% | 68/194 |
| Arable land | 5,444 | 1.9% | 92/191 |
| Permanent crops | 1,927 | 0.7% | |
| Meadows and pastures | 33,914 | 11.8% | |
| Arable land per person | 0.18 acres per person | 134/191 |
Compare the agricultural land of Chile with other countries
Sources:
- World Bank | Agriculture & Rural Development (1961–2024, updated October 2026)
Creative Commons Attribution (CC BY): you may copy, share, adapt and reuse this content, also commercially, as long as you credit statistics.wiki and note any changes you made. The sources listed above may have their own license terms.