
Agriculture, industry and services as a share of GDP by country (2025)
| Rank | Country | Agriculture | Industry | Services |
|---|---|---|---|---|
 World |
4.0% | 25.0% | 63.3% (2024) | |
| 1 |  Monaco |
n/a | 12.8% | 87.2% (2024) |
| 2 |  Cayman Islands |
0.5% | 7.6% | 86.5% (2024) |
| 3 |  Luxembourg |
0.2% | 8.9% | 81.4% |
| 4 |  Sao Tome |
12.2% | 2.2% | 81.4% |
| 5 |  Malta |
0.5% | 10.1% | 81.3% |
| 6 |  United States |
0.9% | 17.3% | 79.7% (2024) |
| 7 |  Andorra |
0.5% | 12.8% | 77.8% |
| 8 |  Bahamas |
0.5% | 9.6% | 77.2% (2024) |
| 9 |  Cyprus |
1.1% | 11.1% | 76.8% |
| 10 |  Barbados |
1.6% | 12.2% | 75.8% (2024) |
| 11 |  Djibouti |
2.3% | 16.6% | 75.7% |
| 12 |  Saint Lucia |
1.7% | 10.7% | 73.8% |
| 13 |  Cuba |
1.2% | 23.8% | 73.4% (2024) |
| 14 |  United Kingdom |
0.6% | 16.5% | 73.1% |
| 15 |  Palau |
2.7% | 13.0% | 73.1% (2024) |
| 16 |  Israel |
1.3% | 17.2% | 72.8% (2024) |
| 17 |  Curacao |
0.3% | 12.2% | 72.3% (2024) |
| 18 |  Samoa |
9.1% | 10.2% | 72.1% |
| 19 |  Switzerland |
0.6% | 25.0% | 71.7% |
| 20 |  East Timor |
20.2% | 11.8% | 71.6% (2024) |
| 21 |  Singapore |
0.0% | 22.7% | 71.6% |
| 22 |  Japan |
1.0% | 26.8% | 71.4% (2024) |
| 23 |  Belgium |
0.7% | 18.6% | 71.2% |
| 24 |  France |
1.4% | 16.8% | 70.9% |
| 25 |  Netherlands |
1.7% | 17.7% | 70.4% |
| 26 |  Kiribati |
23.2% | 11.8% | 70.3% (2024) |
| 27 |  Panama |
2.6% | 24.9% | 70.0% |
| 28 |  Maldives |
4.6% | 9.3% | 69.9% |
| 29 |  Costa Rica |
3.4% | 19.9% | 69.2% |
| 30 |  Antigua |
1.5% | 18.2% | 68.7% |
| 31 |  Spain |
2.7% | 19.6% | 68.4% |
| 32 |  New Zealand |
4.0% | 19.4% | 68.2% (2023) |
| 33 |  Marshall Islands |
19.9% | 13.4% | 68.2% (2024) |
| 34 |  Seychelles |
2.6% | 14.3% | 67.9% |
| 35 |  Cape Verde |
5.0% | 10.7% | 67.9% |
| 36 |  Australia |
2.3% | 23.9% | 67.5% |
| 37 |  Greece |
3.6% | 15.2% | 67.4% |
| 38 |  Sweden |
1.5% | 21.0% | 67.0% |
| 39 |  Portugal |
2.0% | 18.3% | 66.6% |
| 40 |  Saint Vincent |
3.4% | 15.1% | 66.4% |
| 41 |  Iceland |
3.7% | 20.1% | 66.2% |
| 42 |  Saint Kitts |
1.3% | 20.8% | 66.2% |
| 43 |  Estonia |
1.6% | 19.7% | 65.8% |
| 44 |  Uruguay |
6.4% | 16.9% | 65.2% |
| 45 |  Grenada |
2.5% | 15.5% | 64.9% |
| 46 |  Lithuania |
2.3% | 22.1% | 64.8% |
| 47 |  Botswana |
1.8% | 27.9% | 64.6% |
| 48 |  Italy |
2.1% | 22.6% | 64.5% |
| 49 |  Germany |
0.9% | 25.2% | 64.5% |
| 50 |  Philippines |
8.6% | 27.0% | 64.4% |
| 51 |  Latvia |
4.0% | 18.7% | 64.2% |
| 52 |  Canada |
1.9% | 27.4% | 64.1% (2022) |
| 53 |  Austria |
1.3% | 24.0% | 64.1% |
| 54 |  Georgia |
5.2% | 18.6% | 63.9% |
| 55 |  Mauritius |
4.6% | 17.7% | 63.9% |
| 56 |  Montenegro |
3.4% | 11.3% | 63.4% |
| 57 |  Bulgaria |
2.5% | 21.2% | 63.3% |
| 58 |  South Africa |
2.8% | 24.1% | 63.1% |
| 59 |  Tunisia |
10.3% | 22.0% | 62.7% |
| 60 |  Denmark |
1.2% | 24.8% | 62.7% |
| 61 |  Belize |
7.9% | 14.6% | 62.4% (2024) |
| 62 |  Guatemala |
9.6% | 21.8% | 62.1% |
| 63 |  Finland |
2.6% | 22.5% | 62.1% |
| 64 |  Romania |
3.0% | 25.3% | 61.7% |
| 65 |  Togo |
20.3% | 21.0% | 61.7% |
| 66 |  Moldova |
7.4% | 16.9% | 61.5% |
| 67 |  Armenia |
7.9% | 23.1% | 61.3% |
| 68 |  Ukraine |
7.6% | 17.9% | 61.0% |
| 69 |  Croatia |
2.8% | 19.0% | 60.9% |
| 70 |  Czech Republic |
1.9% | 28.7% | 60.8% |
| 71 |  Palestine |
5.5% | 16.3% | 60.2% (2024) |
| 72 |  Thailand |
8.7% | 31.1% | 60.2% |
| 73 |  Dominican Republic |
4.6% | 28.4% | 60.1% |
| 74 |  Hungary |
2.7% | 23.0% | 60.1% |
| 75 |  Jamaica |
8.7% | 16.3% | 59.8% |
| 76 |  Slovakia |
1.6% | 28.1% | 59.8% |
| 77 |  Poland |
2.5% | 25.8% | 59.7% |
| 78 |  Brazil |
6.1% | 20.1% | 59.7% |
| 79 |  Serbia |
3.3% | 22.3% | 59.7% |
| 80 |  Kuwait |
0.5% | 54.1% | 59.6% |
| 81 |  Turkey |
5.2% | 24.0% | 59.4% |
| 82 |  Trinidad |
0.8% | 34.6% | 59.2% (2024) |
| 83 |  Mexico |
3.9% | 30.6% | 58.9% |
| 84 |  Russia |
3.1% | 29.7% | 58.9% |
| 85 |  El Salvador |
4.4% | 24.5% | 58.9% |
| 86 |  Slovenia |
1.6% | 28.3% | 58.6% |
| 87 |  Colombia |
9.9% | 21.8% | 58.5% |
| 88 |  Nigeria |
23.0% | 16.4% | 58.2% |
| 89 |  Taiwan |
1.5% | 40.4% | 58.1% (2024) |
| 90 |  Kazakhstan |
3.7% | 32.3% | 57.7% |
| 91 |  China |
6.7% | 35.6% | 57.7% |
| 92 |  Bosnia |
4.4% | 21.5% | 57.7% |
| 93 |  Honduras |
13.3% | 25.4% | 57.6% |
| 94 |  Liechtenstein |
0.2% | 39.1% | 57.4% (2023) |
| 95 |  South Korea |
1.5% | 34.3% | 57.2% |
| 96 |  Dominica |
12.1% | 14.1% | 57.2% |
| 97 |  Zambia |
4.1% | 35.3% | 57.0% |
| 98 |  Ecuador |
9.7% | 25.7% | 57.0% |
| 99 |  Fiji |
14.0% | 13.9% | 57.0% |
| 100 |  North Macedonia |
6.0% | 24.1% | 57.0% |
| 101 |  San Marino |
0.0% | 35.8% | 56.9% (2023) |
| 102 |  Jordan |
5.6% | 27.4% | 56.8% |
| 103 |  Vanuatu |
26.6% | 10.1% | 56.8% (2024) |
| 104 |  Ireland |
1.1% | 37.8% | 56.7% |
| 105 |  South Sudan |
10.4% | 33.1% | 56.6% (2015) |
| 106 |  Argentina |
5.5% | 22.9% | 56.2% |
| 107 |  Lesotho |
6.5% | 25.2% | 55.6% |
| 108 |  Equatorial Guinea |
3.2% | 41.4% | 55.5% |
| 109 |  Chile |
3.5% | 31.4% | 55.5% |
| 110 |  Kenya |
23.2% | 16.3% | 55.1% |
| 111 |  Norway |
1.6% | 34.5% | 55.0% |
| 112 |  Namibia |
7.0% | 28.9% | 55.0% |
| 113 |  UAE |
0.8% | 44.3% | 54.9% (2024) |
| 114 |  Malaysia |
8.2% | 35.7% | 54.8% |
| 115 |  Sri Lanka |
8.4% | 25.4% | 54.6% |
| 116 |  Nepal |
21.6% | 12.1% | 54.4% |
| 117 |  Bahrain |
0.2% | 41.2% | 54.3% |
| 118 |  Congo |
10.1% | 35.6% | 54.3% |
| 119 |  Haiti |
15.8% | 27.5% | 54.2% |
| 120 |  Bolivia |
8.8% | 31.3% | 53.4% (2024) |
| 121 |  Bhutan |
13.7% | 33.2% | 53.2% |
| 122 |  Gambia |
23.8% | 15.8% | 53.1% |
| 123 |  Eswatini |
6.4% | 33.6% | 52.4% |
| 124 |  Rwanda |
20.3% | 22.0% | 52.3% |
| 125 |  Morocco |
10.5% | 25.2% | 52.3% |
| 126 |  Iraq |
3.4% | 45.4% | 52.3% |
| 127 |  Bangladesh |
11.4% | 34.0% | 52.1% |
| 128 |  Kyrgyzstan |
8.0% | 26.5% | 51.2% |
| 129 |  Ivory Coast |
16.8% | 23.9% | 51.2% |
| 130 |  Pakistan |
23.0% | 20.1% | 50.9% |
| 131 |  Peru |
7.5% | 34.3% | 50.9% (2024) |
| 132 |  Suriname |
6.8% | 35.1% | 50.8% (2024) |
| 133 |  Cameroon |
16.8% | 24.8% | 50.4% |
| 134 |  Benin |
22.9% | 17.5% | 50.1% |
| 135 |  Belarus |
6.9% | 31.6% | 50.0% |
| 136 |  Albania |
14.8% | 21.8% | 49.7% |
| 137 |  Tonga |
18.6% | 17.7% | 49.5% (2024) |
| 138 |  India |
16.2% | 25.2% | 49.3% |
| 139 |  Saudi Arabia |
2.6% | 43.0% | 48.9% |
| 140 |  Turkmenistan |
12.4% | 36.0% | 48.9% |
| 141 |  Madagascar |
21.7% | 23.9% | 48.8% |
| 142 |  Comoros |
36.6% | 9.9% | 48.8% |
| 143 |  Malawi |
30.0% | 14.3% | 48.7% |
| 144 |  Zimbabwe |
9.5% | 37.1% | 48.2% |
| 145 |  Paraguay |
11.6% | 32.3% | 48.1% |
| 146 |  DR Congo |
8.9% | 39.7% | 48.0% |
| 147 |  Egypt |
16.6% | 32.1% | 47.3% |
| 148 |  Oman |
2.8% | 52.7% | 47.2% |
| 149 |  Iran |
10.6% | 39.6% | 47.1% |
| 150 |  Qatar |
0.3% | 57.0% | 47.0% |
| 151 |  Solomon Islands |
29.7% | 23.4% | 46.9% (2024) |
| 152 |  Angola |
25.2% | 27.1% | 46.8% |
| 153 |  Uzbekistan |
16.6% | 32.5% | 46.5% |
| 154 |  Senegal |
17.1% | 26.1% | 46.3% |
| 155 |  Algeria |
14.5% | 34.8% | 45.7% |
| 156 |  Azerbaijan |
5.9% | 39.5% | 45.3% |
| 157 |  Nicaragua |
14.5% | 29.3% | 45.2% |
| 158 |  Afghanistan |
34.3% | 14.5% | 45.2% (2024) |
| 159 |  Syria |
42.9% | 11.9% | 44.7% (2022) |
| 160 |  Mongolia |
8.9% | 37.2% | 44.3% |
| 161 |  Indonesia |
13.1% | 38.7% | 43.9% |
| 162 |  Laos |
16.6% | 29.2% | 43.6% |
| 163 |  Ghana |
21.3% | 29.3% | 42.9% |
| 164 |  Vietnam |
11.6% | 37.6% | 42.7% |
| 165 |  Mauritania |
20.0% | 29.7% | 42.4% |
| 166 |  Gabon |
6.8% | 47.2% | 42.3% |
| 167 |  Uganda |
26.1% | 24.3% | 42.1% |
| 168 |  Burundi |
34.3% | 18.2% | 42.1% |
| 169 |  Mozambique |
25.6% | 22.1% | 42.0% |
| 170 |  Papua New Guinea |
17.0% | 36.5% | 42.0% (2024) |
| 171 |  Yemen |
28.7% | 25.4% | 41.8% (2018) |
| 172 |  Sierra Leone |
29.5% | 25.7% | 41.6% |
| 173 |  Burkina Faso |
19.9% | 30.1% | 41.5% |
| 174 |  CAR |
27.6% | 21.2% | 41.4% |
| 175 |  Brunei |
1.2% | 60.0% | 40.2% |
| 176 |  Liberia |
32.7% | 24.5% | 40.0% |
| 177 |  Guinea-Bissau |
40.6% | 15.7% | 39.1% |
| 178 |  Myanmar |
25.3% | 36.2% | 38.5% |
| 179 |  Sudan |
29.4% | 33.6% | 37.0% |
| 180 |  Ethiopia |
32.8% | 27.8% | 36.6% |
| 181 |  Mali |
33.0% | 23.4% | 36.6% |
| 182 |  Tajikistan |
23.1% | 32.4% | 36.5% (2024) |
| 183 |  Lebanon |
1.0% | 2.6% | 35.7% (2024) |
| 184 |  Guinea |
31.3% | 25.4% | 35.7% |
| 185 |  Cambodia |
16.1% | 43.1% | 35.0% |
| 186 |  Chad |
36.3% | 26.7% | 33.9% |
| 187 |  Niger |
47.6% | 18.7% | 31.1% |
| 188 |  Tanzania |
22.9% | 29.8% | 28.8% |
| 189 |  Libya |
1.5% | 73.2% | 26.9% |
| 190 |  Guyana |
7.7% | 75.1% | 14.8% |
| Not ranked: latest data before 2015 | ||||
 Venezuela |
5.0% | 37.2% | 51.7% (2014) | |
The list ranks 190 countries by the share of services in their latest GDP, from Monaco (87.2%, 2024) to Guyana (14.8%). Half of the countries had a services share below 57.2%.
GDP by sector divides the value added in an economy among three sectors: agriculture (with forestry and fishing), industry (mining, manufacturing, construction, and electricity, gas and water supply) and services (trade, transport, finance, housing, public administration, education, health and the rest). The three shares do not add up to 100%: GDP also includes taxes on products minus subsidies, which belong to no sector.
GDP by sector by country map
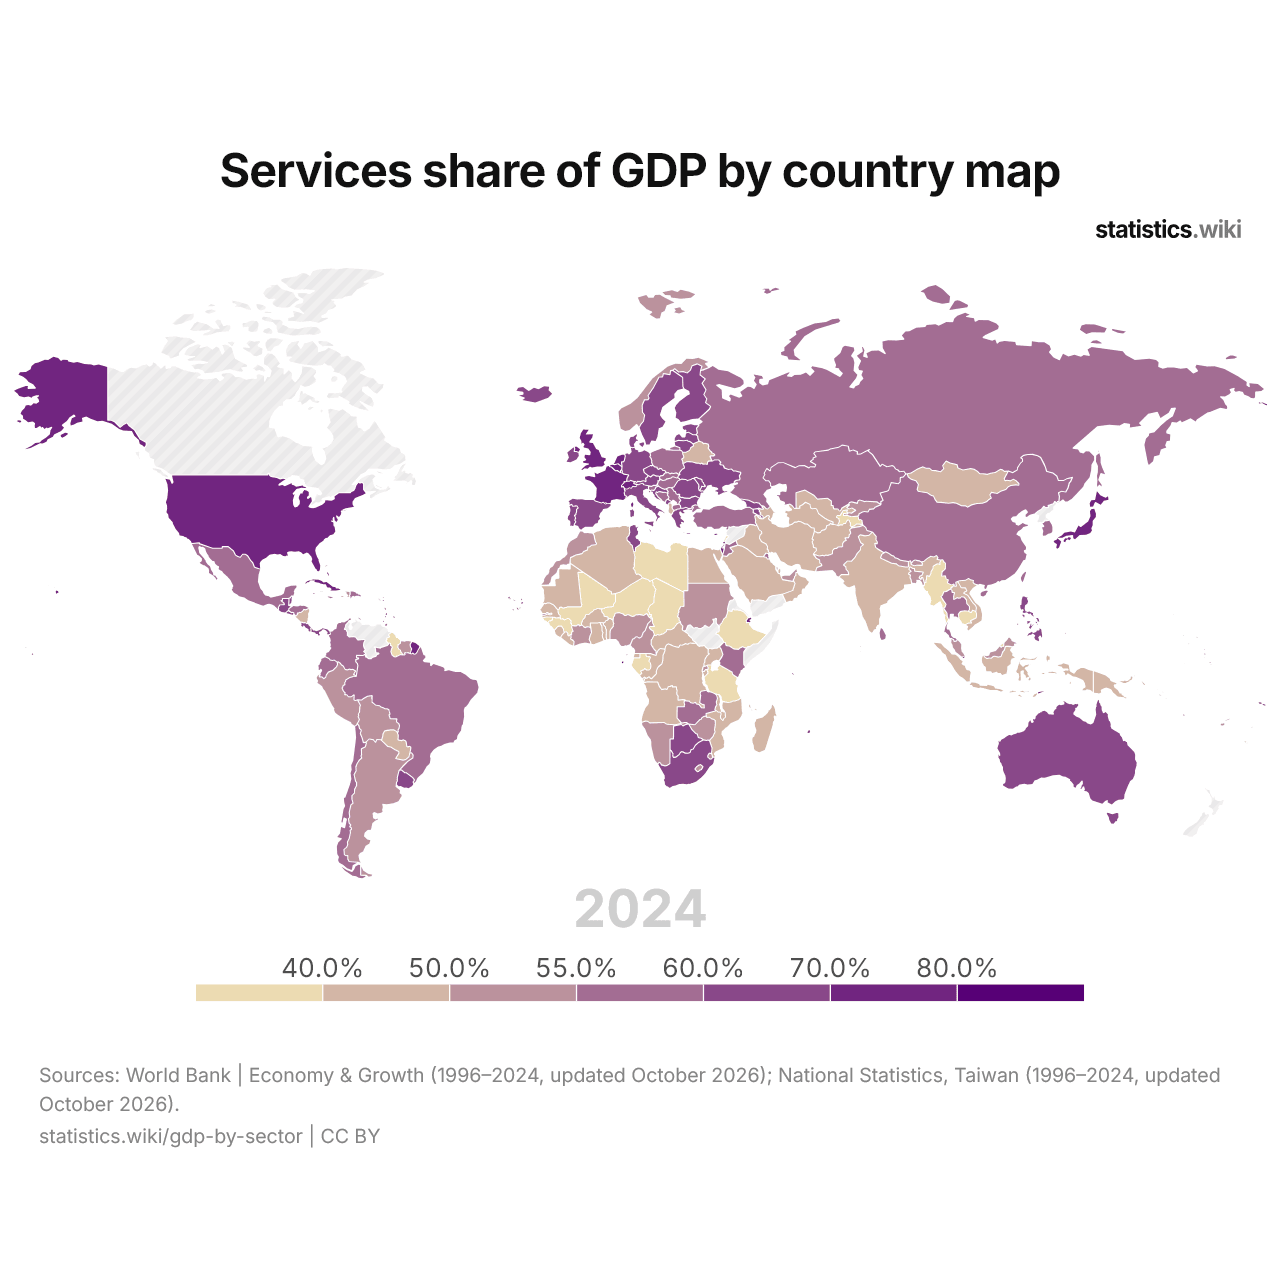
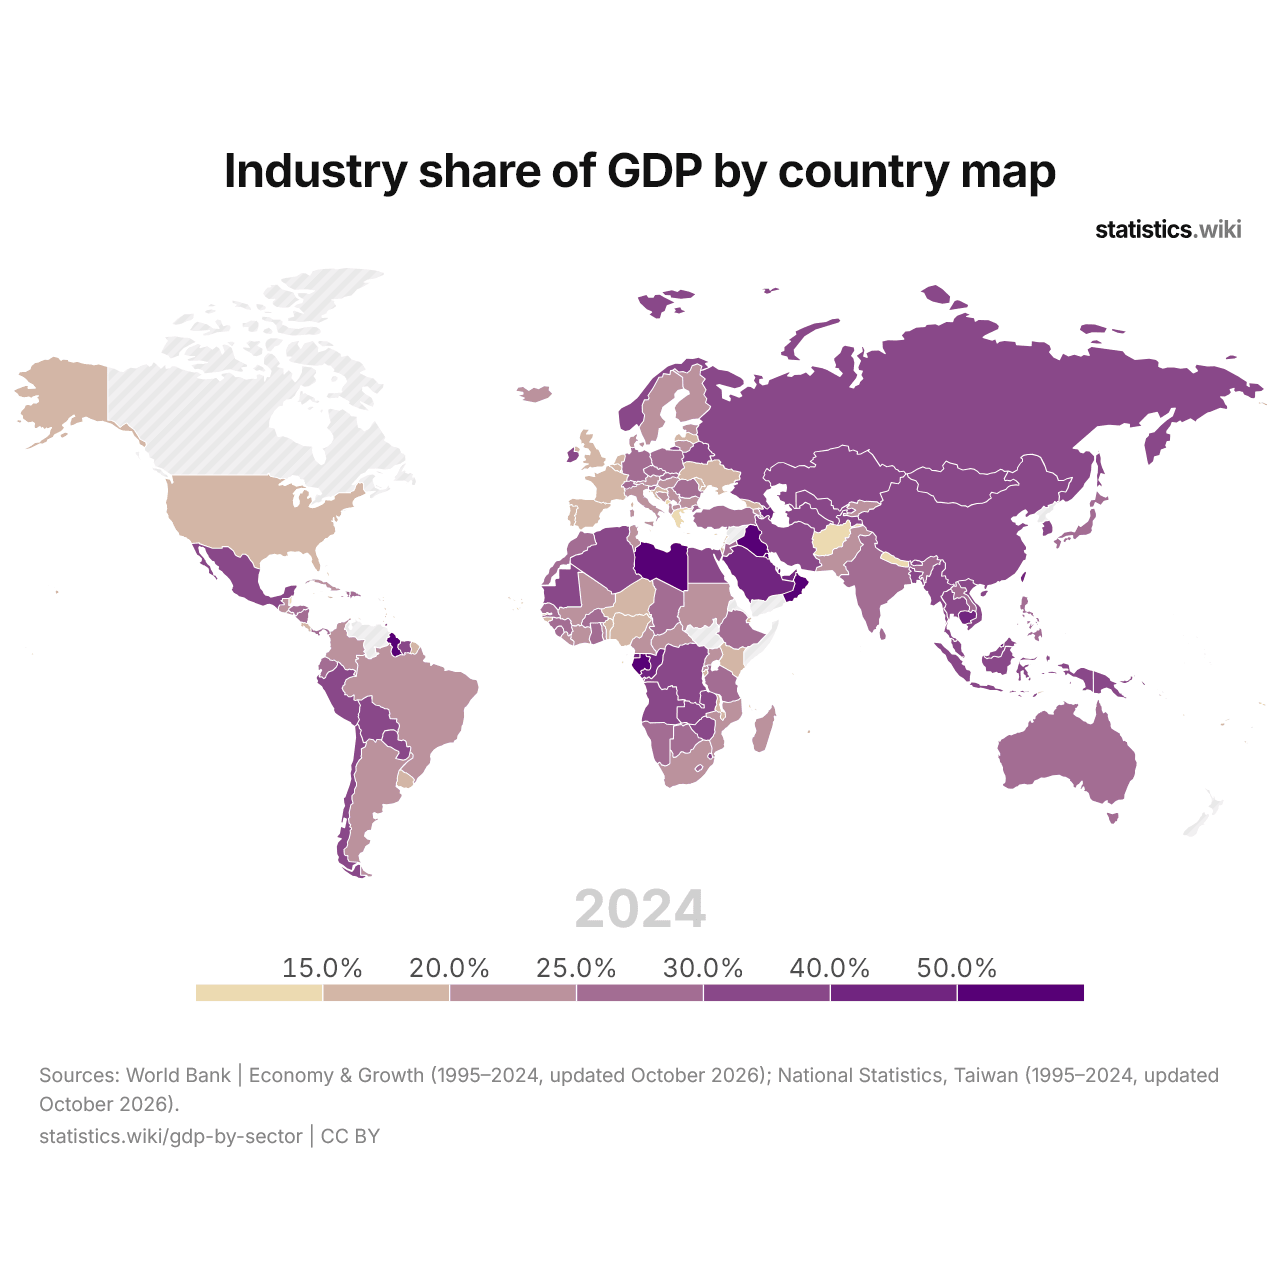
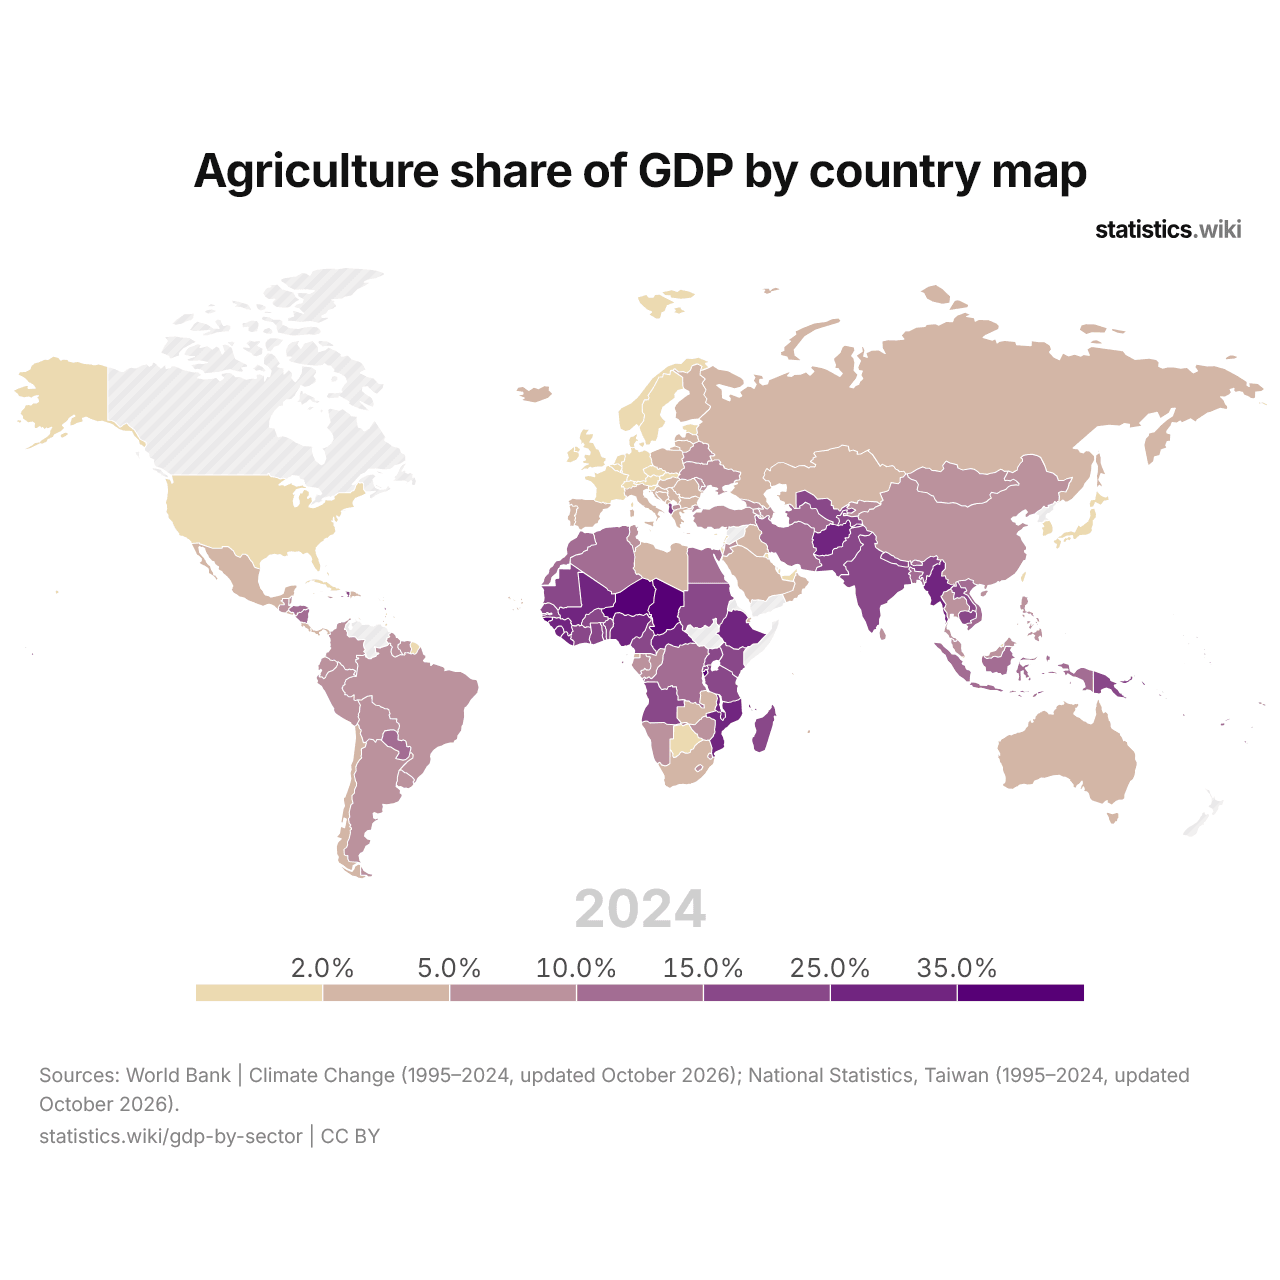
Services make up more than 60% of GDP in 70 countries, compared with 37 in 1996. Agriculture makes up more than 25% of GDP in 18 countries, compared with 39 in 1995.
World GDP by sector, 1981–2025
| Year | Share of GDP | ||
|---|---|---|---|
| Services | Industry | Agriculture | |
| 2025 | - | 25% | 4% |
| 2024 | 63.3% | 25.4% | 4.1% |
| 2023 | 63% | 26.2% | 4.1% |
| 2022 | 62.3% | 27.2% | 4.3% |
| 2021 | 64.1% | 27% | 4.3% |
| 2020 | 65.4% | 25.9% | 4.4% |
| 2019 | 64.9% | 26.6% | 4% |
| 2018 | 64.3% | 27.2% | 3.9% |
| 2017 | 64.5% | 26.7% | 4.1% |
| 2016 | 65% | 26.2% | 4.1% |
| 2015 | 64.4% | 26.8% | 4.2% |
| 2014 | 63.2% | 27.7% | 4.2% |
| 2013 | 62.9% | 27.9% | 4.2% |
| 2012 | 62.7% | 28.2% | 4% |
| 2011 | 62.6% | 28.2% | 4% |
| 2010 | 63.3% | 27.6% | 3.8% |
| 2009 | 64.7% | 26.6% | 3.6% |
| 2008 | 62.8% | 28.2% | 3.5% |
| 2007 | 63.2% | 27.8% | 3.4% |
| 2006 | 63.6% | 27.7% | 3.2% |
| 2005 | 64.3% | 27.2% | 3.2% |
| 2004 | 64.8% | 26.8% | 3.3% |
| 2003 | 65.5% | 26.4% | 3.3% |
| 2002 | 65.7% | 26.4% | 3.3% |
| 2001 | 65.2% | 26.9% | 3.3% |
| 2000 | 64.2% | 27.8% | 3.4% |
| 1999 | 64.3% | 27.4% | 3.5% |
| 1998 | 63.8% | 27.6% | 3.8% |
| 1997 | 62.9% | 28.5% | 3.9% |
| 1996 | 64.4% | 29.5% | 4% |
| 1995 | 65.4% | 30.1% | 3.9% |
| 1994 | - | 30.1% | 3.9% |
| 1993 | - | 29.9% | 3.9% |
| 1992 | - | 31.5% | 4.1% |
| 1991 | - | 32.1% | 4.6% |
| 1990 | - | - | 5.1% |
| 1989 | - | - | 5.3% |
| 1988 | - | - | 5.3% |
| 1987 | - | - | 5.5% |
| 1986 | - | - | 6% |
| 1985 | - | - | 6.7% |
| 1984 | - | - | 6.9% |
| 1983 | - | - | 7% |
| 1982 | - | - | 7% |
| 1981 | - | - | 7.2% |
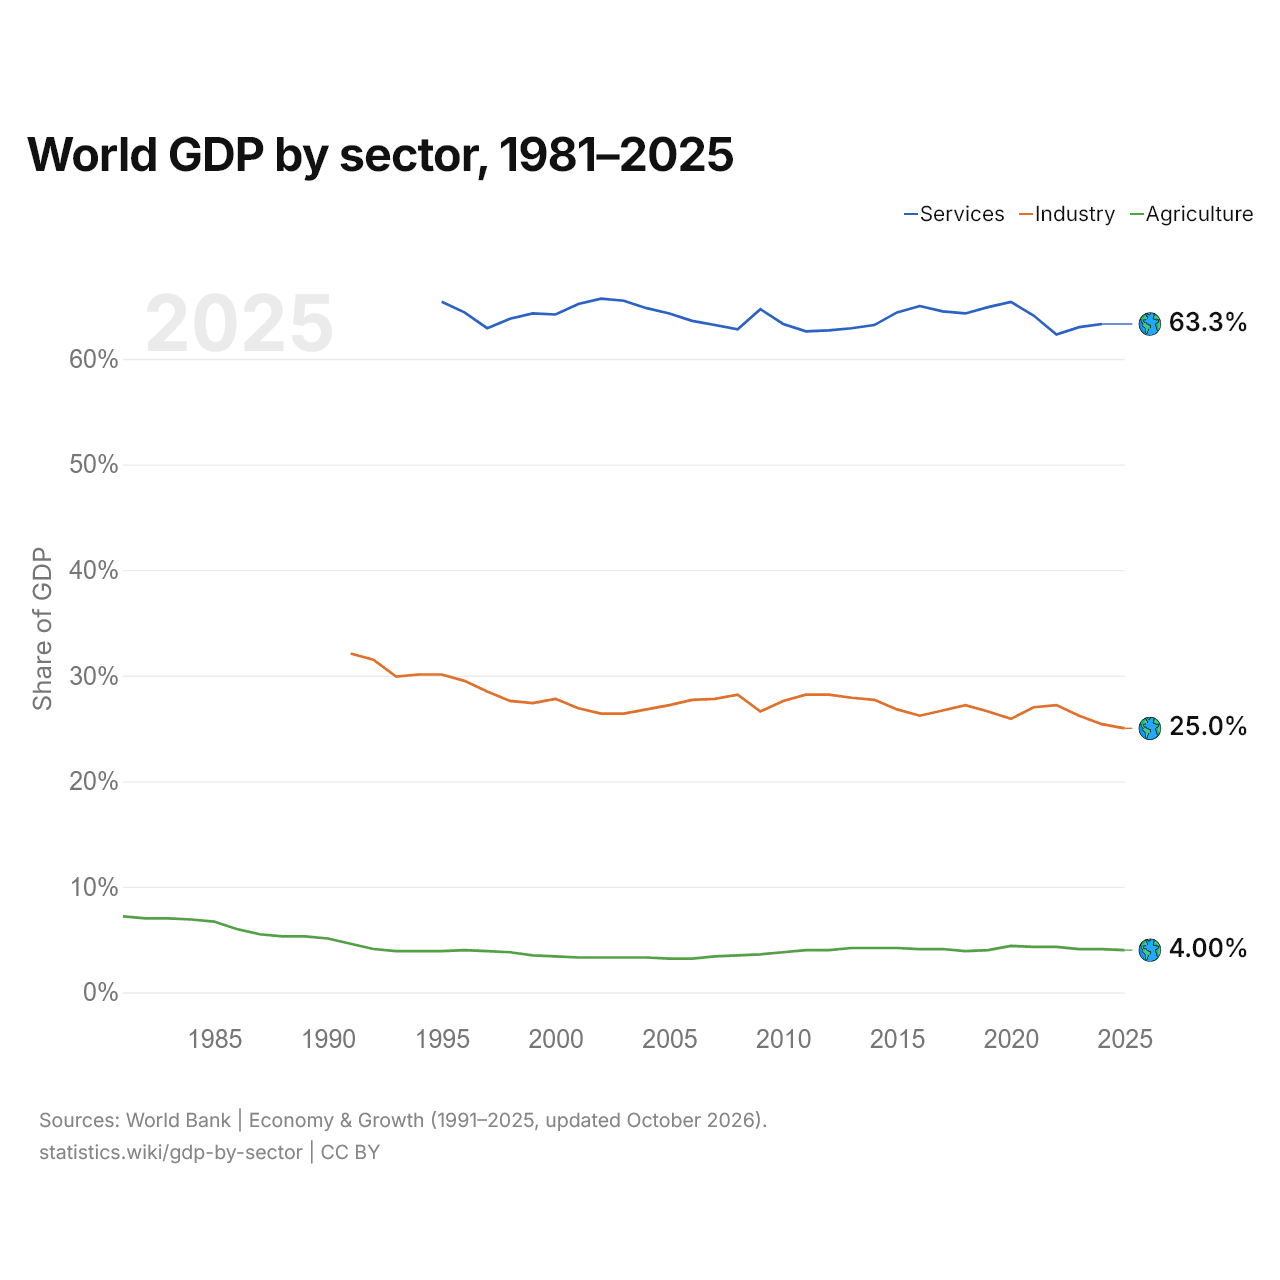
Services made up 63.3% of world GDP, industry 25.4% and agriculture 4.1%. In 1995, the shares were 65.4%, 30.1% and 3.9%.
Agriculture, industry and services as a share of GDP in the world and the regions
-
World
Services 63.3% · Industry 25.4% · Agriculture 4.1%
-
 North America
Services 79.7% · Industry 17.3% · Agriculture 0.9%
-
 Europe
Services 66.0% · Industry 22.7% · Agriculture 1.6%
-
 Oceania
Services 65.7% · Industry 25.7% · Agriculture 2.4%
-
 Latin America
Services 58.0% · Industry 25.9% · Agriculture 5.6%
-
 Asia
Services 56.6% · Industry 33.8% · Agriculture 7.0%
-
 Africa
Services 49.8% · Industry 28.1% · Agriculture 16.3%
Among the regions, services make up from 79.7% of GDP in North America to 49.8% in Africa. The share of agriculture is highest in Africa, at 16.3%, and the share of industry in Asia, at 33.8%.
Agriculture, industry and services as a share of GDP in the 10 largest economies (2025)
-
United States
(2024)
Services 79.7% · Industry 17.3% · Agriculture 0.9%
-
China
Services 57.7% · Industry 35.6% · Agriculture 6.7%
-
Germany
Services 64.5% · Industry 25.2% · Agriculture 0.9%
-
Japan
(2024)
Services 71.4% · Industry 26.8% · Agriculture 1.0%
-
United Kingdom
Services 73.1% · Industry 16.5% · Agriculture 0.6%
-
India
Services 49.3% · Industry 25.2% · Agriculture 16.2%
-
France
Services 70.9% · Industry 16.8% · Agriculture 1.4%
-
Russia
Services 58.9% · Industry 29.7% · Agriculture 3.1%
-
Italy
Services 64.5% · Industry 22.6% · Agriculture 2.1%
-
Canada
(2022)
Services 64.1% · Industry 27.4% · Agriculture 1.9%
Of the ten largest economies, services make up the largest share of GDP in the United States, 79.7% (2024), and the smallest in India, 49.3%. The share of agriculture is highest in India, at 16.2%, and the share of industry in China, at 35.6%.
The 10 countries with the largest share of agriculture in GDP (2025)
The 10 countries with the largest share of industry in GDP (2025)
Agriculture makes up 47.6% of GDP in Niger, the largest share of any country, and industry 75.1% in Guyana. Of the ten countries with the largest share of agriculture, eight are in Africa; of the ten with the largest share of industry, seven are in Asia.
Compare the GDP by sector of any 2 countries
Sources:
- World Bank | Economy & Growth (1991–2025, updated October 2026)
- National Statistics, Taiwan (1995–2024, updated October 2026)
Creative Commons Attribution (CC BY): you may copy, share, adapt and reuse this content, also commercially, as long as you credit statistics.wiki and note any changes you made. The sources listed above may have their own license terms.