
List of countries by labor force (2025)
| Rank | Country | Labor force | Share of world | Participation rate |
|---|---|---|---|---|
 World |
3.74B | 60.2% | ||
| 1 |  China |
768M | 20.6% | 64.6% |
| 2 |  India |
618M | 16.5% | 55.7% |
| 3 |  United States |
175M | 4.68% | 61.7% |
| 4 |  Indonesia |
147M | 3.94% | 68.0% |
| 5 |  Nigeria |
117M | 3.12% | 82.5% |
| 6 |  Brazil |
108M | 2.9% | 63.1% |
| 7 |  Pakistan |
85.2M | 2.28% | 52.3% |
| 8 |  Bangladesh |
74.7M | 2% | 58.8% |
| 9 |  Russia |
72.8M | 1.95% | 61.1% |
| 10 |  Japan |
69.5M | 1.86% | 63.4% |
| 11 |  Mexico |
61.7M | 1.65% | 61.6% |
| 12 |  Vietnam |
57M | 1.53% | 72.8% |
| 13 |  Ethiopia |
56.8M | 1.52% | 68.5% |
| 14 |  Philippines |
52.2M | 1.4% | 61.4% |
| 15 |  Germany |
43.5M | 1.17% | 60.6% |
| 16 |  Thailand |
40.9M | 1.09% | 66.7% |
| 17 |  DR Congo |
39.2M | 1.05% | 64.3% |
| 18 |  Turkey |
36.9M | 0.99% | 54.4% |
| 19 |  Egypt |
36.1M | 0.97% | 44.6% |
| 20 |  United Kingdom |
35.4M | 0.95% | 61.4% |
| 21 |  Tanzania |
34.1M | 0.91% | 83.7% |
| 22 |  France |
31.9M | 0.85% | 55.3% |
| 23 |  South Korea |
29.9M | 0.8% | 64.4% |
| 24 |  Iran |
29.5M | 0.79% | 41.0% |
| 25 |  Colombia |
27.1M | 0.73% | 63.4% |
| 26 |  South Africa |
26.7M | 0.72% | 55.6% |
| 27 |  Italy |
25.7M | 0.69% | 49.3% |
| 28 |  Spain |
24.8M | 0.66% | 57.4% |
| 29 |  Kenya |
24.7M | 0.66% | 67.4% |
| 30 |  Uganda |
23.4M | 0.63% | 80.0% |
| 31 |  Myanmar |
22.9M | 0.61% | 55.1% |
| 32 |  Canada |
22.8M | 0.61% | 64.5% |
| 33 |  Argentina |
22.4M | 0.6% | 61.9% |
| 34 |  Ukraine |
20.5M (2021) | 0.58% | 54.6% |
| 35 |  Peru |
19.2M | 0.51% | 72.9% |
| 36 |  Malaysia |
18.7M | 0.5% | 66.1% |
| 37 |  Saudi Arabia |
18.4M | 0.49% | 65.1% |
| 38 |  Poland |
18.2M | 0.49% | 58.3% |
| 39 |  North Korea |
17.7M | 0.47% | 82.2% |
| 40 |  Madagascar |
17.1M | 0.46% | 85.5% |
| 41 |  Angola |
16.3M | 0.44% | 74.8% |
| 42 |  Mozambique |
15.7M | 0.42% | 78.7% |
| 43 |  Australia |
15.1M | 0.4% | 66.5% |
| 44 |  Uzbekistan |
14.6M | 0.39% | 57.5% |
| 45 |  Algeria |
13.6M | 0.36% | 40.8% |
| 46 |  Ghana |
13.3M | 0.35% | 58.5% |
| 47 |  Ivory Coast |
13.1M | 0.35% | 67.1% |
| 48 |  Morocco |
12.6M | 0.34% | 43.9% |
| 49 |  Iraq |
12.5M | 0.33% | 41.5% |
| 50 |  Taiwan |
12.1M | 0.32% | 58.6% |
| 51 |  Niger |
12M | 0.32% | 79.7% |
| 52 |  Cameroon |
11.5M | 0.31% | 65.2% |
| 53 |  Venezuela |
11.1M | 0.3% | 51.9% |
| 54 |  Sudan |
10.9M (2022) | 0.3% | 37.5% |
| 55 |  Cambodia |
10.4M | 0.28% | 82.4% |
| 56 |  Netherlands |
10.3M | 0.28% | 67.2% |
| 57 |  Chile |
10.3M | 0.28% | 62.3% |
| 58 |  Kazakhstan |
10M | 0.27% | 67.8% |
| 59 |  Burkina Faso |
9.91M | 0.27% | 70.0% |
| 60 |  Afghanistan |
9.43M | 0.25% | 37.5% |
| 61 |  Mali |
9.16M | 0.25% | 67.0% |
| 62 |  Ecuador |
8.98M | 0.24% | 64.5% |
| 63 |  Nepal |
8.36M | 0.22% | 39.2% |
| 64 |  Malawi |
8.32M | 0.22% | 62.6% |
| 65 |  Sri Lanka |
8.26M | 0.22% | 48.5% |
| 66 |  Romania |
8.24M | 0.22% | 51.3% |
| 67 |  Yemen |
8.16M | 0.22% | 33.1% |
| 68 |  Zambia |
8.01M | 0.21% | 61.9% |
| 69 |  Guatemala |
7.68M | 0.21% | 59.6% |
| 70 |  UAE |
7.6M | 0.2% | 78.6% |
| 71 |  Bolivia |
6.98M | 0.19% | 78.6% |
| 72 |  Zimbabwe |
6.85M | 0.18% | 67.7% |
| 73 |  Syria |
6.76M | 0.18% | 36.9% |
| 74 |  Chad |
6.75M | 0.18% | 59.4% |
| 75 |  Benin |
6.64M | 0.18% | 76.4% |
| 76 |  Burundi |
6.31M | 0.17% | 78.3% |
| 77 |  Senegal |
6.13M | 0.16% | 52.0% |
| 78 |  Rwanda |
5.84M | 0.16% | 63.7% |
| 79 |  Sweden |
5.7M | 0.15% | 64.6% |
| 80 |  Czech Republic |
5.58M | 0.15% | 60.3% |
| 81 |  Dominican Republic |
5.51M | 0.15% | 64.8% |
| 82 |  Portugal |
5.49M | 0.15% | 58.2% |
| 83 |  Belgium |
5.46M | 0.15% | 54.3% |
| 84 |  Haiti |
5.27M | 0.14% | 63.9% |
| 85 |  Switzerland |
5.17M | 0.14% | 66.7% |
| 86 |  Azerbaijan |
5.11M | 0.14% | 63.3% |
| 87 |  South Sudan |
5.07M (2023) | 0.14% | 73.4% |
| 88 |  Hungary |
4.94M | 0.13% | 60.6% |
| 89 |  Cuba |
4.86M | 0.13% | 52.2% |
| 90 |  Israel |
4.83M | 0.13% | 65.5% |
| 91 |  Belarus |
4.8M | 0.13% | 62.7% |
| 92 |  Austria |
4.75M | 0.13% | 60.1% |
| 93 |  Guinea |
4.72M | 0.13% | 52.6% |
| 94 |  Greece |
4.72M | 0.13% | 52.0% |
| 95 |  Honduras |
4.34M | 0.12% | 56.6% |
| 96 |  Tunisia |
4.27M | 0.11% | 45.2% |
| 97 |  Singapore |
3.76M | 0.1% | 69.7% |
| 98 |  Papua New Guinea |
3.75M | 0.1% | 52.1% |
| 99 |  Laos |
3.65M | 0.1% | 66.1% |
| 100 |  Somalia |
3.56M | 0.1% | 33.8% |
| 101 |  Paraguay |
3.53M | 0.09% | 70.2% |
| 102 |  Serbia |
3.32M | 0.09% | 59.1% |
| 103 |  Nicaragua |
3.32M | 0.09% | 66.1% |
| 104 |  Denmark |
3.29M | 0.09% | 64.9% |
| 105 |  Jordan |
3.22M | 0.09% | 40.1% |
| 106 |  Norway |
3.09M | 0.08% | 65.6% |
| 107 |  Bulgaria |
3.09M | 0.08% | 56.1% |
| 108 |  New Zealand |
3.08M | 0.08% | 70.4% |
| 109 |  El Salvador |
2.99M | 0.08% | 62.1% |
| 110 |  Togo |
2.96M | 0.08% | 57.8% |
| 111 |  Sierra Leone |
2.93M | 0.08% | 53.4% |
| 112 |  Kuwait |
2.93M | 0.08% | 73.4% |
| 113 |  Ireland |
2.91M | 0.08% | 64.8% |
| 114 |  Finland |
2.89M | 0.08% | 59.7% |
| 115 |  Kyrgyzstan |
2.87M | 0.08% | 57.4% |
| 116 |  Oman |
2.84M | 0.08% | 68.4% |
| 117 |  Slovakia |
2.76M | 0.07% | 60.4% |
| 118 |  Liberia |
2.67M | 0.07% | 76.6% |
| 119 |  Tajikistan |
2.65M | 0.07% | 38.3% |
| 120 |  Congo |
2.64M | 0.07% | 67.8% |
| 121 |  Libya |
2.62M | 0.07% | 48.0% |
| 122 |  Costa Rica |
2.43M | 0.06% | 57.7% |
| 123 |  Panama |
2.29M | 0.06% | 66.3% |
| 124 |  Turkmenistan |
2.2M | 0.06% | 42.0% |
| 125 |  Qatar |
2.2M | 0.06% | 87.0% |
| 126 |  CAR |
2.08M | 0.06% | 73.4% |
| 127 |  Georgia |
2.01M | 0.05% | 64.3% |
| 128 |  Lebanon |
1.84M (2023) | 0.05% | 43.4% |
| 129 |  Uruguay |
1.81M | 0.05% | 65.0% |
| 130 |  Eritrea |
1.76M | 0.05% | 78.3% |
| 131 |  Croatia |
1.74M | 0.05% | 52.1% |
| 132 |  Jamaica |
1.61M | 0.04% | 69.6% |
| 133 |  Lithuania |
1.55M | 0.04% | 62.9% |
| 134 |  Armenia |
1.49M | 0.04% | 59.4% |
| 135 |  Mongolia |
1.46M | 0.04% | 59.7% |
| 136 |  Palestine |
1.39M (2022) | 0.04% | 45.0% |
| 137 |  Moldova |
1.37M | 0.04% | 72.3% |
| 138 |  Bosnia |
1.34M | 0.04% | 49.0% |
| 139 |  Albania |
1.26M | 0.03% | 64.3% |
| 140 |  Mauritania |
1.25M | 0.03% | 40.8% |
| 141 |  Botswana |
1.2M | 0.03% | 68.8% |
| 142 |  Namibia |
1.15M | 0.03% | 58.8% |
| 143 |  Slovenia |
1.05M | 0.03% | 57.6% |
| 144 |  Latvia |
948K | 0.03% | 60.5% |
| 145 |  Bahrain |
920K | 0.02% | 70.4% |
| 146 |  Guinea-Bissau |
899K | 0.02% | 64.8% |
| 147 |  Lesotho |
890K | 0.02% | 57.1% |
| 148 |  Gabon |
844K | 0.02% | 51.1% |
| 149 |  Gambia |
807K | 0.02% | 47.5% |
| 150 |  North Macedonia |
789K | 0.02% | 51.9% |
| 151 |  Cyprus |
770K | 0.02% | 67.0% |
| 152 |  Estonia |
754K | 0.02% | 65.1% |
| 153 |  Equatorial Guinea |
738K | 0.02% | 60.5% |
| 154 |  Trinidad |
652K | 0.02% | 57.8% |
| 155 |  East Timor |
635K | 0.02% | 67.0% |
| 156 |  Mauritius |
622K | 0.02% | 58.5% |
| 157 |  Solomon Islands |
449K | 0.01% | 84.3% |
| 158 |  Eswatini |
431K | 0.01% | 51.2% |
| 159 |  Bhutan |
411K | 0.01% | 64.8% |
| 160 |  Fiji |
390K | 0.01% | 57.2% |
| 161 |  Luxembourg |
356K | 0.01% | 61.5% |
| 162 |  Guyana |
327K | 0.009% | 55.0% |
| 163 |  Malta |
323K | 0.009% | 64.0% |
| 164 |  Comoros |
311K | 0.008% | 55.8% |
| 165 |  Montenegro |
297K | 0.008% | 58.0% |
| 166 |  Maldives |
272K | 0.007% | 63.5% |
| 167 |  Djibouti |
268K | 0.007% | 31.7% |
| 168 |  Suriname |
257K | 0.007% | 53.8% |
| 169 |  Bahamas |
245K | 0.007% | 73.8% |
| 170 |  Iceland |
243K | 0.006% | 74.9% |
| 171 |  Brunei |
238K | 0.006% | 64.2% |
| 172 |  Cape Verde |
226K | 0.006% | 57.0% |
| 173 |  Belize |
184K | 0.005% | 59.1% |
| 174 |  Barbados |
152K | 0.004% | 64.7% |
| 175 |  Vanuatu |
121K | 0.003% | 58.1% |
| 176 |  Saint Lucia |
102K | 0.003% | 68.3% |
| 177 |  Curacao |
73K (2013) | 0.002% | n/a |
| 178 |  Samoa |
57.8K | 0.002% | 42.5% |
| 179 |  Grenada |
55.3K (2017) | 0.002% | n/a |
| 180 |  Saint Vincent |
53.7K | 0.001% | 67.9% |
| 181 |  Monaco |
52K (2017) | 0.002% | n/a |
| 182 |  Seychelles |
51K (2018) | 0.001% | n/a |
| 183 |  Andorra |
39.8K (2016) | 0.001% | n/a |
| 184 |  Cayman Islands |
39K (2017) | 0.001% | n/a |
| 184 |  Kiribati |
39K (2017) | 0.001% | n/a |
| 186 |  Liechtenstein |
38.5K (2012) | 0.001% | n/a |
| 187 |  Sao Tome |
35.1K | <0.001% | 23.3% |
| 188 |  Tonga |
33.6K | <0.001% | 49.8% |
| 189 |  Antigua |
30K (2006) | <0.001% | n/a |
| 190 |  Dominica |
25K (2003) | <0.001% | n/a |
| 191 |  San Marino |
22K (2013) | <0.001% | n/a |
| 192 |  Palau |
11.6K (2016) | <0.001% | n/a |
| 193 |  Marshall Islands |
10.7K (2013) | <0.001% | n/a |
The list ranks 193 countries by the size of their labor force, from China (768 million) to the Marshall Islands (10,700, 2013). The world's labor force was 3.74 billion people in 2025. Half of the countries had a labor force smaller than 3.76 million.
The labor force is everyone aged 15 and over who works or is looking for work: employees, the self-employed, people who help in a family business and the unemployed. Students, retired people and others who neither work nor look for work are not part of it. The participation rate is the labor force as a share of all people aged 15 and over.
Labor force by country map, 1990–2025
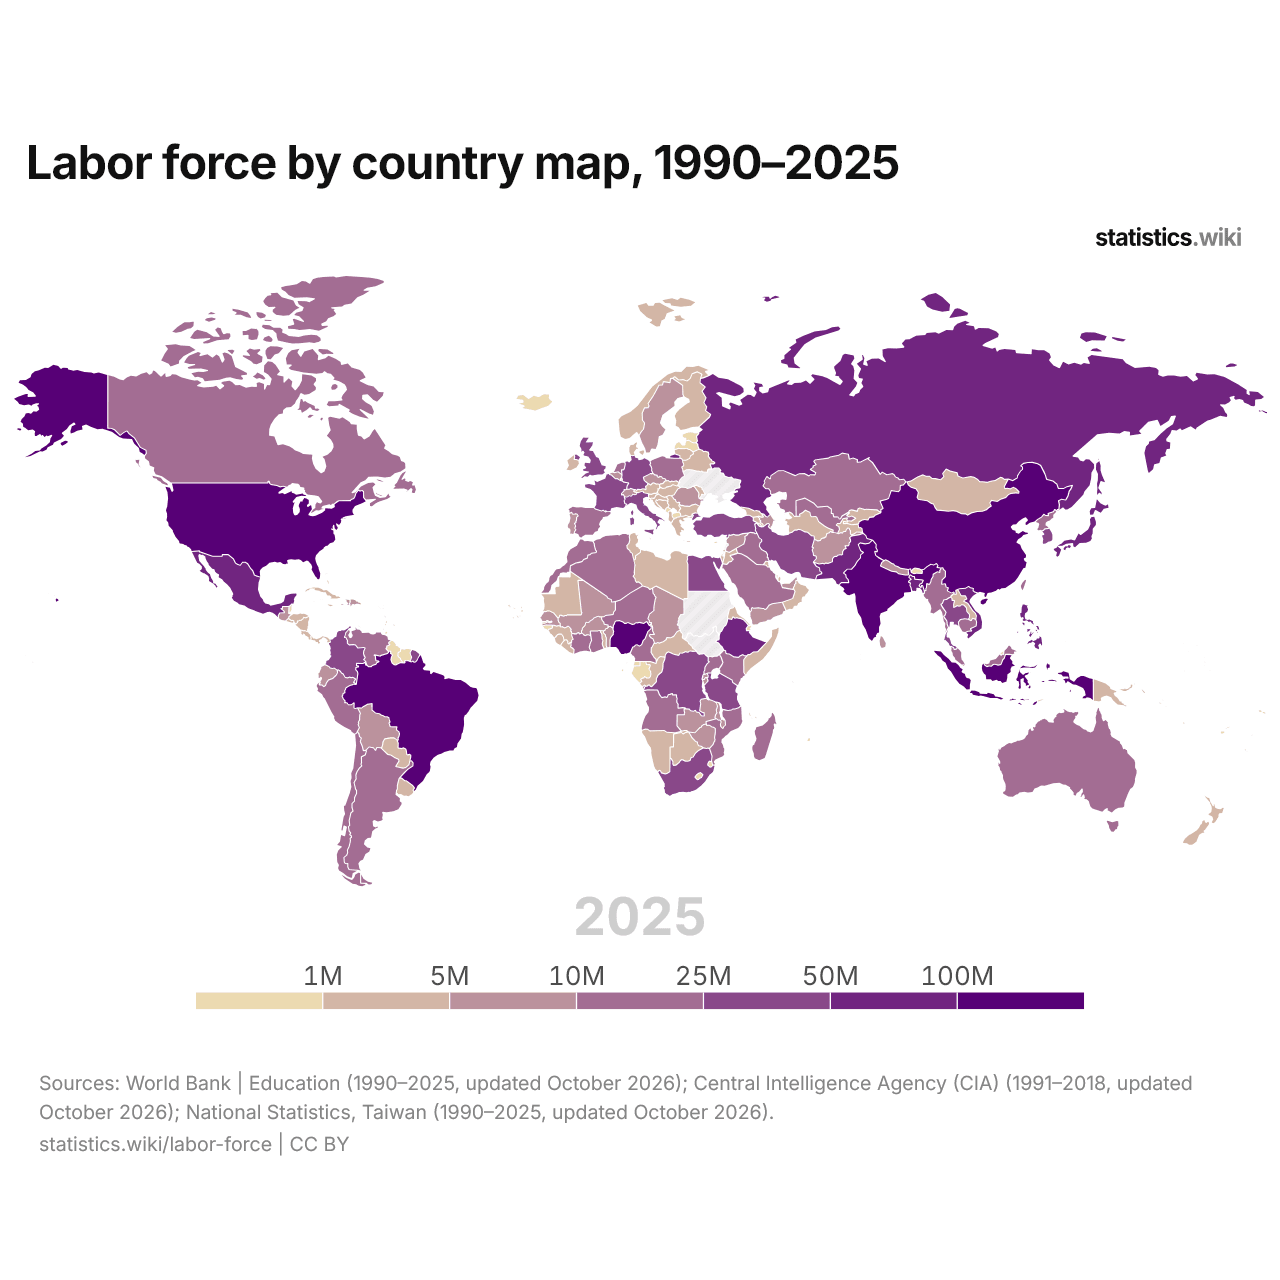
In 2025, 14 countries had a labor force of more than 50 million people and 37 had fewer than 1 million; in 1990, the numbers were 7 and 51.
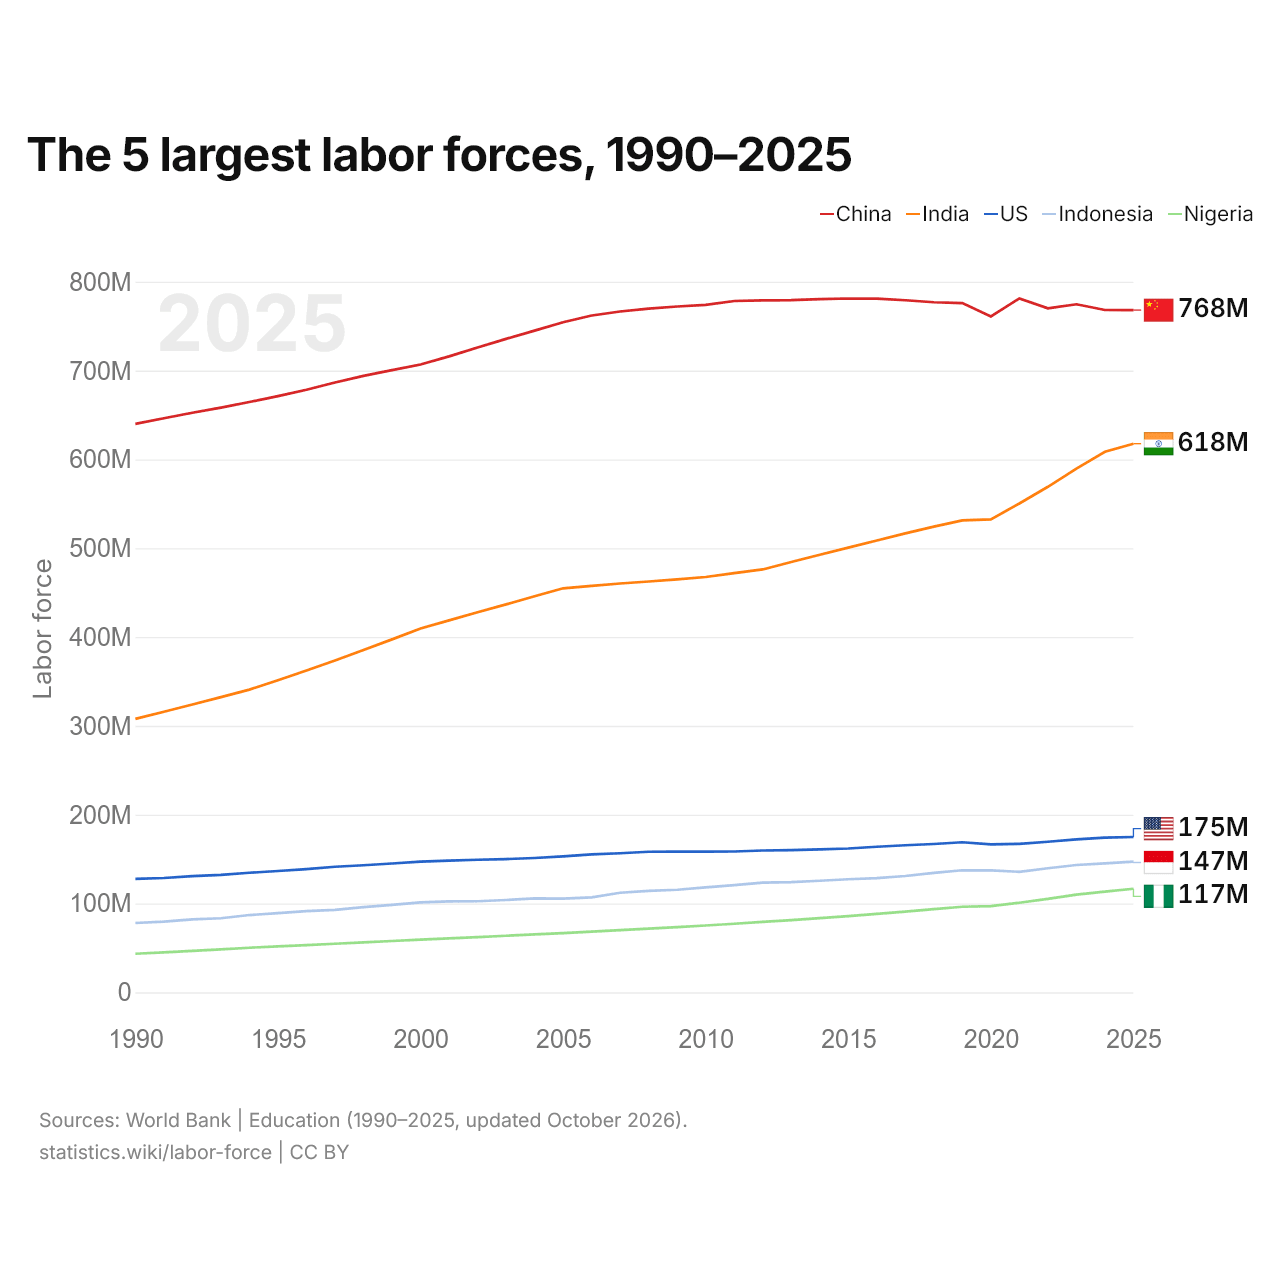
The 5 largest labor forces, 1990–2025
| Year | Labor force | ||||
|---|---|---|---|---|---|
| China | India | United States | Indonesia | Nigeria | |
| 2025 | 768,071,923 | 617,625,336 | 174,833,917 | 147,104,597 | 116,581,818 |
| 2024 | 768,163,717 | 608,500,805 | 174,166,487 | 145,198,137 | 113,320,742 |
| 2023 | 774,607,590 | 589,486,854 | 172,274,620 | 143,318,723 | 110,075,281 |
| 2022 | 770,113,477 | 569,155,867 | 169,483,435 | 139,637,843 | 105,269,418 |
| 2021 | 781,187,865 | 550,352,877 | 167,182,400 | 135,672,770 | 100,887,576 |
| 2020 | 760,877,838 | 532,528,354 | 166,565,253 | 137,375,390 | 97,041,268 |
| 2019 | 775,928,449 | 531,373,378 | 168,920,514 | 137,425,585 | 96,335,866 |
| 2018 | 776,868,988 | 524,292,869 | 167,002,008 | 134,532,894 | 93,615,892 |
| 2017 | 779,166,682 | 516,713,963 | 165,597,316 | 130,940,742 | 90,905,566 |
| 2016 | 780,932,880 | 508,681,288 | 163,886,456 | 128,501,300 | 88,256,929 |
| 2015 | 781,077,009 | 500,640,619 | 161,927,418 | 127,299,364 | 85,773,802 |
| 2014 | 780,370,287 | 492,680,645 | 160,876,331 | 125,645,513 | 83,458,627 |
| 2013 | 779,251,311 | 484,466,830 | 160,132,463 | 124,097,473 | 81,303,065 |
| 2012 | 779,022,561 | 476,101,422 | 159,682,753 | 123,448,397 | 79,317,244 |
| 2011 | 778,275,581 | 471,891,929 | 158,537,150 | 120,648,289 | 77,225,150 |
| 2010 | 773,873,234 | 467,561,989 | 158,330,168 | 118,205,102 | 75,284,751 |
| 2009 | 772,141,043 | 464,953,334 | 158,353,162 | 115,441,860 | 73,499,013 |
| 2008 | 769,779,554 | 462,536,166 | 158,272,885 | 114,200,383 | 71,669,029 |
| 2007 | 766,486,940 | 460,225,575 | 156,588,966 | 112,145,843 | 69,975,807 |
| 2006 | 761,959,276 | 457,611,460 | 155,267,046 | 106,957,017 | 68,316,893 |
| 2005 | 754,465,388 | 454,832,471 | 153,120,588 | 105,482,562 | 66,741,004 |
| 2004 | 744,936,890 | 445,825,854 | 151,218,126 | 105,759,801 | 65,217,367 |
| 2003 | 735,682,023 | 436,753,652 | 149,992,325 | 103,909,546 | 63,693,782 |
| 2002 | 725,938,760 | 427,829,074 | 149,241,895 | 102,498,864 | 62,235,800 |
| 2001 | 715,928,584 | 418,764,922 | 148,213,470 | 102,354,432 | 60,772,025 |
| 2000 | 706,837,950 | 409,617,771 | 147,139,887 | 101,308,307 | 59,281,872 |
| 1999 | 700,431,310 | 397,354,085 | 145,083,084 | 98,429,095 | 57,821,632 |
| 1998 | 694,011,207 | 385,347,723 | 143,097,780 | 95,861,387 | 56,231,989 |
| 1997 | 686,473,251 | 373,673,862 | 141,357,334 | 92,859,996 | 54,708,361 |
| 1996 | 678,359,927 | 362,330,724 | 138,775,669 | 91,432,137 | 53,211,071 |
| 1995 | 671,238,114 | 351,330,547 | 136,621,148 | 89,218,352 | 51,813,787 |
| 1994 | 664,565,882 | 340,802,039 | 134,611,321 | 87,006,941 | 50,215,133 |
| 1993 | 658,329,022 | 332,338,730 | 132,266,996 | 83,361,608 | 48,405,331 |
| 1992 | 652,547,071 | 324,021,661 | 130,853,396 | 82,135,691 | 46,738,488 |
| 1991 | 646,245,556 | 315,875,620 | 128,740,615 | 79,624,184 | 45,040,095 |
| 1990 | 639,912,098 | 307,898,649 | 127,821,416 | 78,081,179 | 43,425,556 |
In 2025, the labor force numbered 768 million in China, 618 million in India, 175 million in the United States, 147 million in Indonesia and 117 million in Nigeria. China's labor force has been the largest of the five every year since 1990.
The 10 largest labor forces each year, 1990–2025
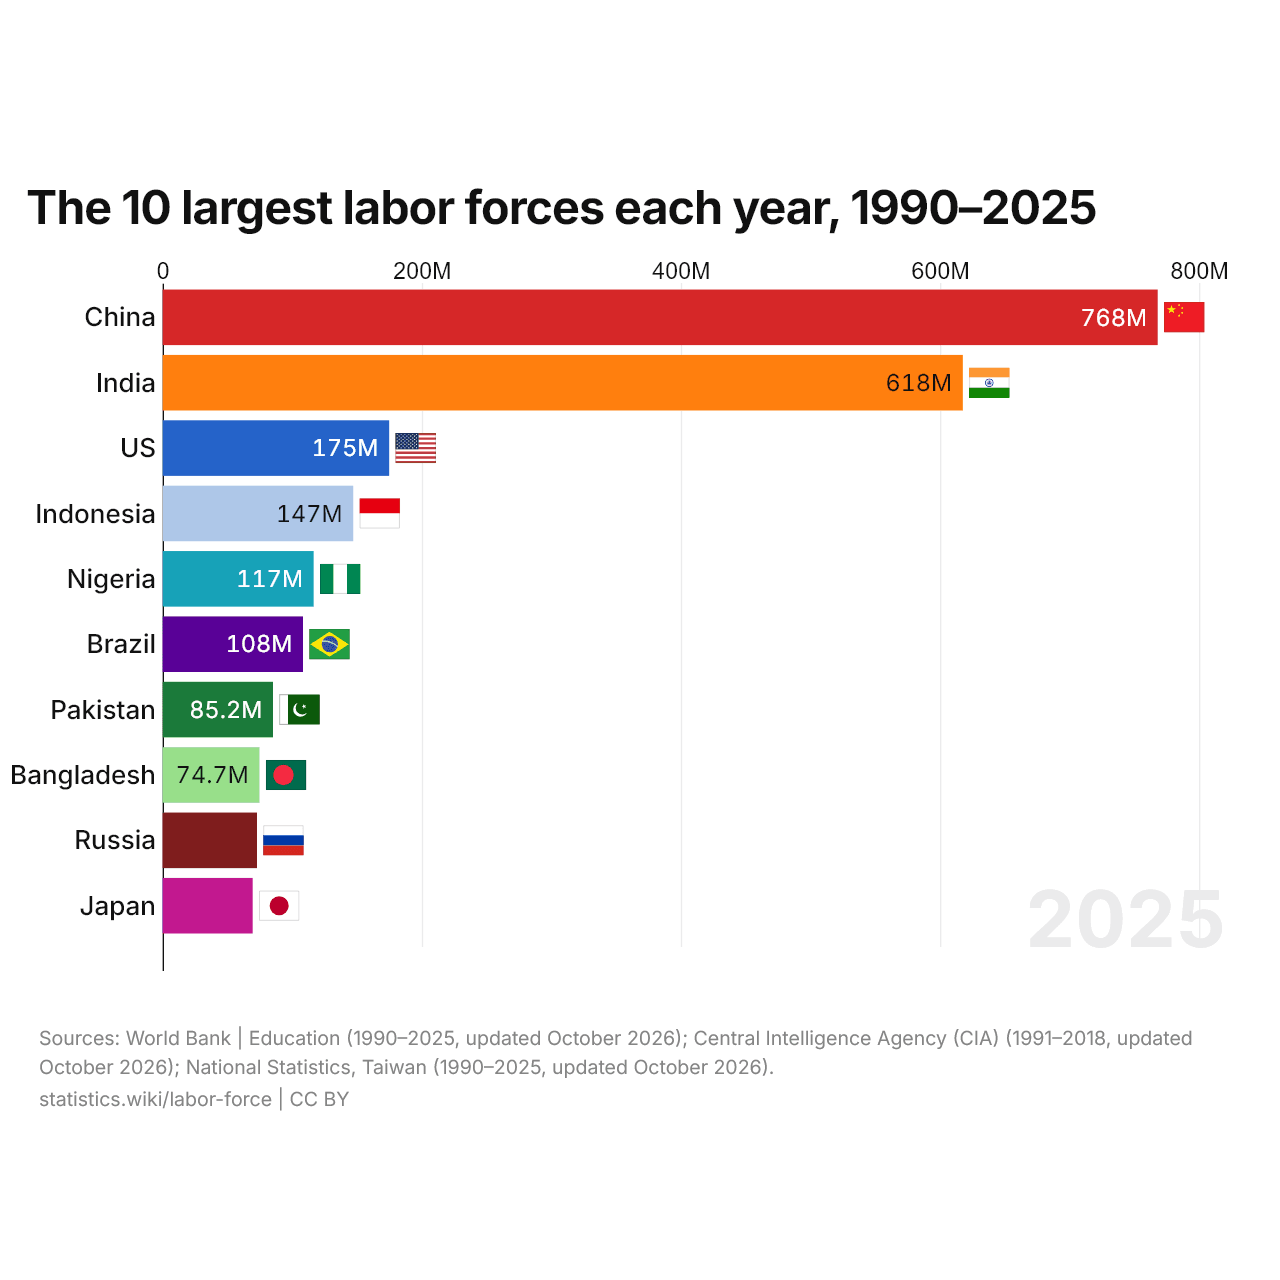
The ten largest labor forces made up 60% of the world's labor force in 2025, compared with 64% in 1990. Pakistan moved up the most among them, from 11th in 1990 to 7th in 2025.
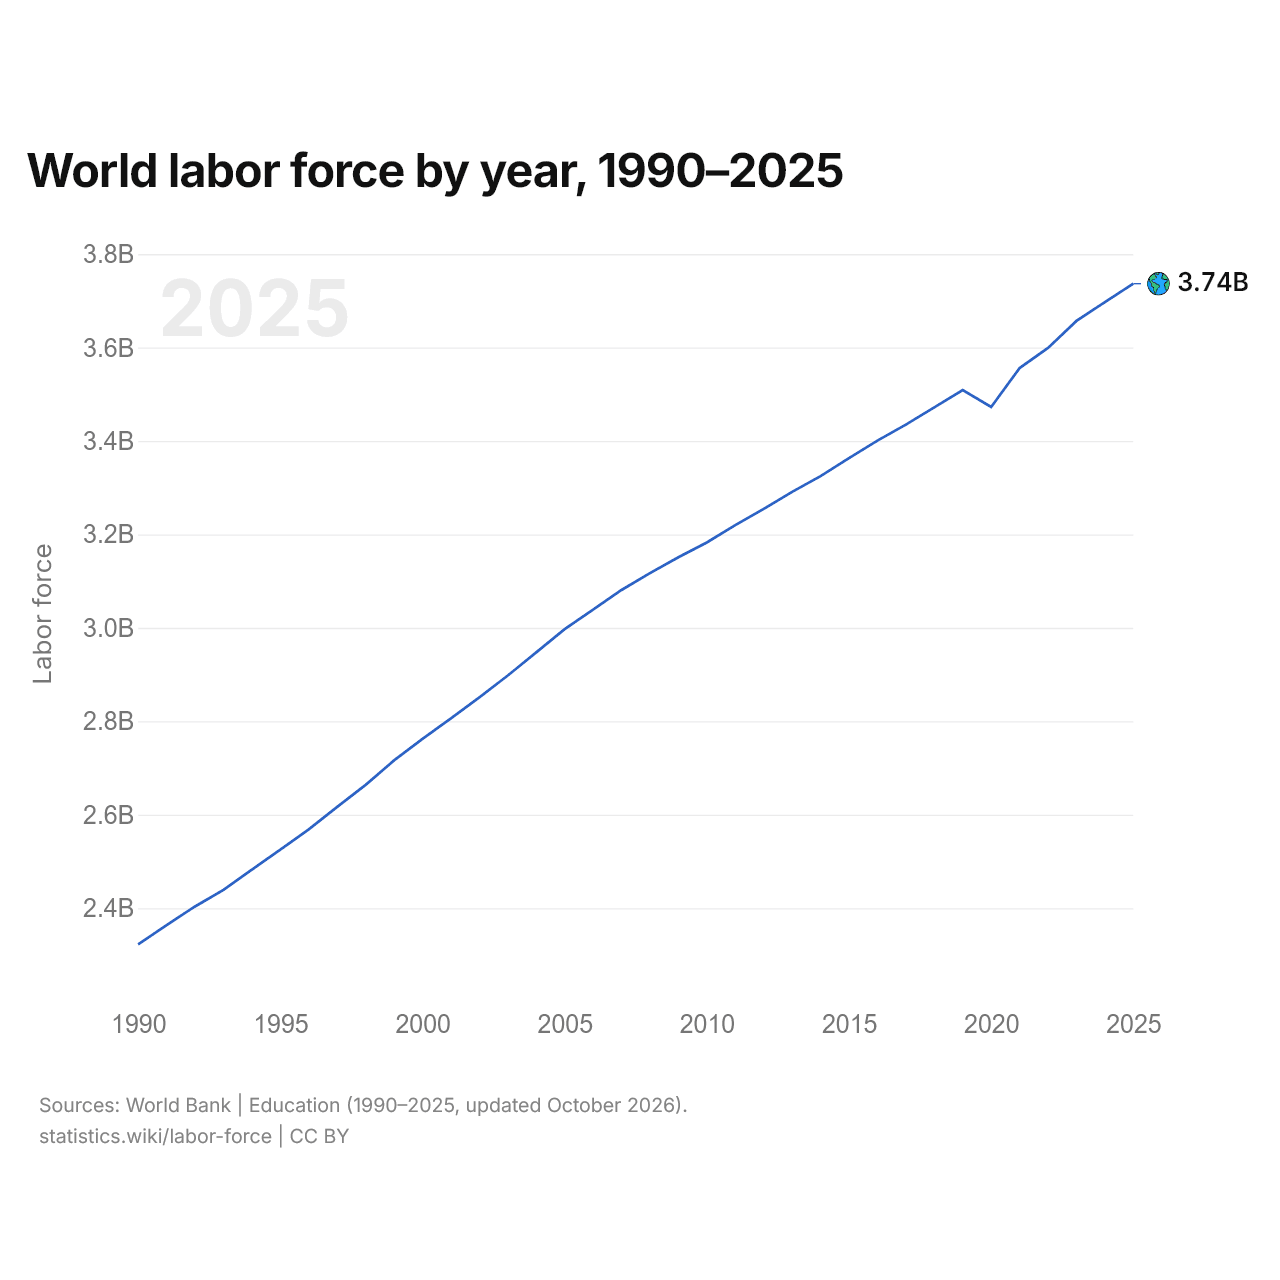
World labor force by year, 1990–2025
| Year | Labor force |
|---|---|
| World | |
| 2025 | 3,736,625,386 |
| 2024 | 3,697,172,611 |
| 2023 | 3,657,009,128 |
| 2022 | 3,599,248,427 |
| 2021 | 3,555,964,088 |
| 2020 | 3,472,746,320 |
| 2019 | 3,508,957,956 |
| 2018 | 3,471,702,582 |
| 2017 | 3,435,038,478 |
| 2016 | 3,400,659,364 |
| 2015 | 3,363,415,327 |
| 2014 | 3,324,856,330 |
| 2013 | 3,290,895,160 |
| 2012 | 3,254,539,083 |
| 2011 | 3,220,004,890 |
| 2010 | 3,182,700,274 |
| 2009 | 3,151,090,637 |
| 2008 | 3,117,244,795 |
| 2007 | 3,081,020,937 |
| 2006 | 3,039,084,034 |
| 2005 | 2,997,070,515 |
| 2004 | 2,947,396,565 |
| 2003 | 2,897,927,722 |
| 2002 | 2,851,071,777 |
| 2001 | 2,806,007,488 |
| 2000 | 2,762,297,138 |
| 1999 | 2,716,185,398 |
| 1998 | 2,663,788,405 |
| 1997 | 2,616,665,469 |
| 1996 | 2,568,708,704 |
| 1995 | 2,525,033,580 |
| 1994 | 2,482,310,968 |
| 1993 | 2,438,896,359 |
| 1992 | 2,403,576,737 |
| 1991 | 2,363,555,638 |
| 1990 | 2,322,587,072 |
The world's labor force numbered 3.74 billion people in 2025, compared with 2.32 billion in 1990. It shrank in 2020 and grew in every other year since 1990.
Compare the labor force of any 2 countries
Sources:
- World Bank | Education (1990–2025, updated October 2026)
- Central Intelligence Agency (CIA) (1991–2018, updated October 2026)
- National Statistics, Taiwan (1990–2025, updated October 2026)
- U.S. Census Bureau (2025, updated October 2026)
Creative Commons Attribution (CC BY): you may copy, share, adapt and reuse this content, also commercially, as long as you credit statistics.wiki and note any changes you made. The sources listed above may have their own license terms.