
Rwanda labor force chart: people aged 15+ working or looking for work, 1990–2025
| Year | Labor force | World rank |
|---|---|---|
 Rwanda |
||
| 2025 | 5,843,274 | #78 |
| 2024 | 5,672,552 | #79 |
| 2023 | 5,531,930 | #80 |
| 2022 | 5,079,189 | #83 |
| 2021 | 4,769,099 | #89 |
| 2020 | 4,981,285 | #84 |
| 2019 | 4,505,832 | #91 |
| 2018 | 4,514,731 | #90 |
| 2017 | 4,388,612 | #90 |
| 2016 | 4,269,266 | #92 |
| 2015 | 4,154,021 | #91 |
| 2014 | 4,042,608 | #92 |
| 2013 | 3,934,027 | #92 |
| 2012 | 3,828,558 | #92 |
| 2011 | 3,725,842 | #92 |
| 2010 | 3,624,033 | #92 |
| 2009 | 3,524,232 | #92 |
| 2008 | 3,428,312 | #93 |
| 2007 | 3,335,780 | #94 |
| 2006 | 3,244,740 | #94 |
| 2005 | 3,153,448 | #94 |
| 2004 | 3,060,533 | #94 |
| 2003 | 2,965,592 | #94 |
| 2002 | 2,878,530 | #95 |
| 2001 | 2,804,806 | #96 |
| 2000 | 2,733,475 | #96 |
| 1999 | 2,658,479 | #96 |
| 1998 | 2,580,156 | #95 |
| 1997 | 2,428,351 | #99 |
| 1996 | 2,069,207 | #103 |
| 1995 | 1,722,936 | #110 |
| 1994 | 2,139,935 | #101 |
| 1993 | 2,579,827 | #91 |
| 1992 | 2,472,843 | #96 |
| 1991 | 2,414,151 | #95 |
| 1990 | 2,364,214 | #94 |
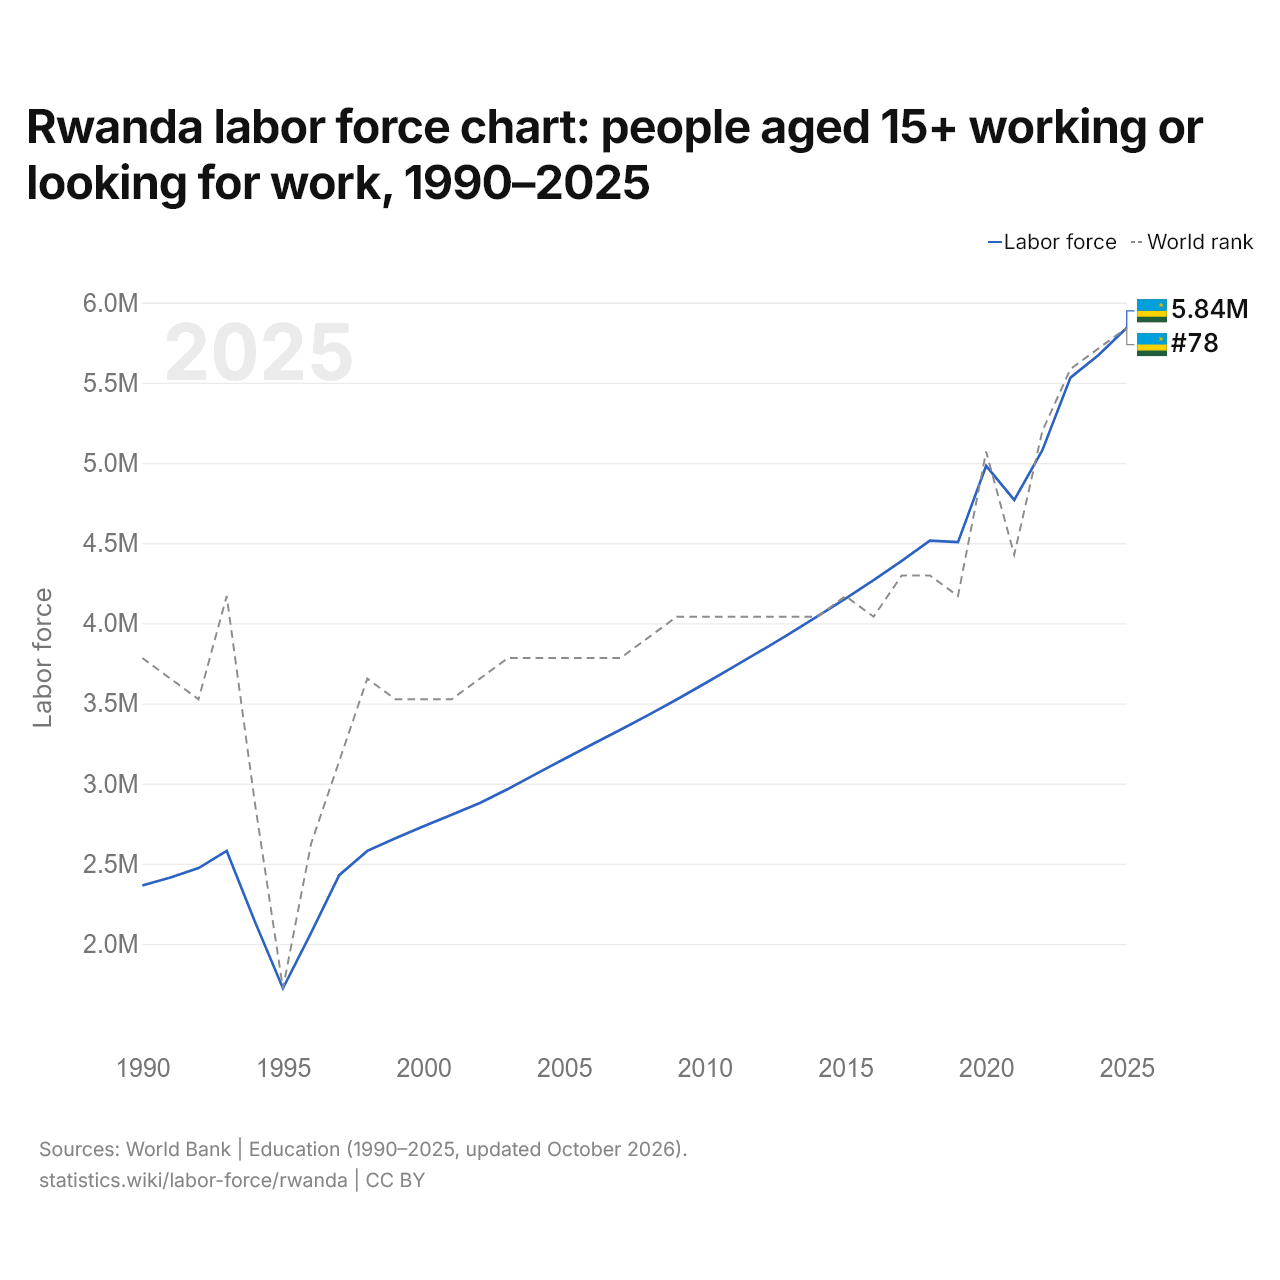
In 2025, Rwanda's labor force numbered 5.84 million, up from 2.36 million in 1990. It was smallest in 1995, at 1.72 million. It was the 78th largest in the world, up from 79th in 2024.
Rwanda's labor force passed 5 million in 2022. In 2025, it was the 28th largest of the 54 countries of Africa.
Rwanda labor force participation rate (% of people aged 15+), 1990–2025
| Year | % of people 15+ |
|---|---|
|
Rwanda
|
|
| 2025 | 63.7% |
| 2024 | 63.5% |
| 2023 | 63.7% |
| 2022 | 60.2% |
| 2021 | 58.2% |
| 2020 | 62.7% |
| 2019 | 58.5% |
| 2018 | 60.4% |
| 2017 | 60.5% |
| 2016 | 60.6% |
| 2015 | 60.6% |
| 2014 | 60.7% |
| 2013 | 60.8% |
| 2012 | 60.9% |
| 2011 | 60.9% |
| 2010 | 61% |
| 2009 | 61.1% |
| 2008 | 61.1% |
| 2007 | 61.1% |
| 2006 | 61.1% |
| 2005 | 61.2% |
| 2004 | 61.3% |
| 2003 | 61.4% |
| 2002 | 61.5% |
| 2001 | 61.8% |
| 2000 | 62.1% |
| 1999 | 62.5% |
| 1998 | 62.9% |
| 1997 | 63.2% |
| 1996 | 63.5% |
| 1995 | 63.8% |
| 1994 | 63.1% |
| 1993 | 62.7% |
| 1992 | 62.8% |
| 1991 | 62.8% |
| 1990 | 62.8% |
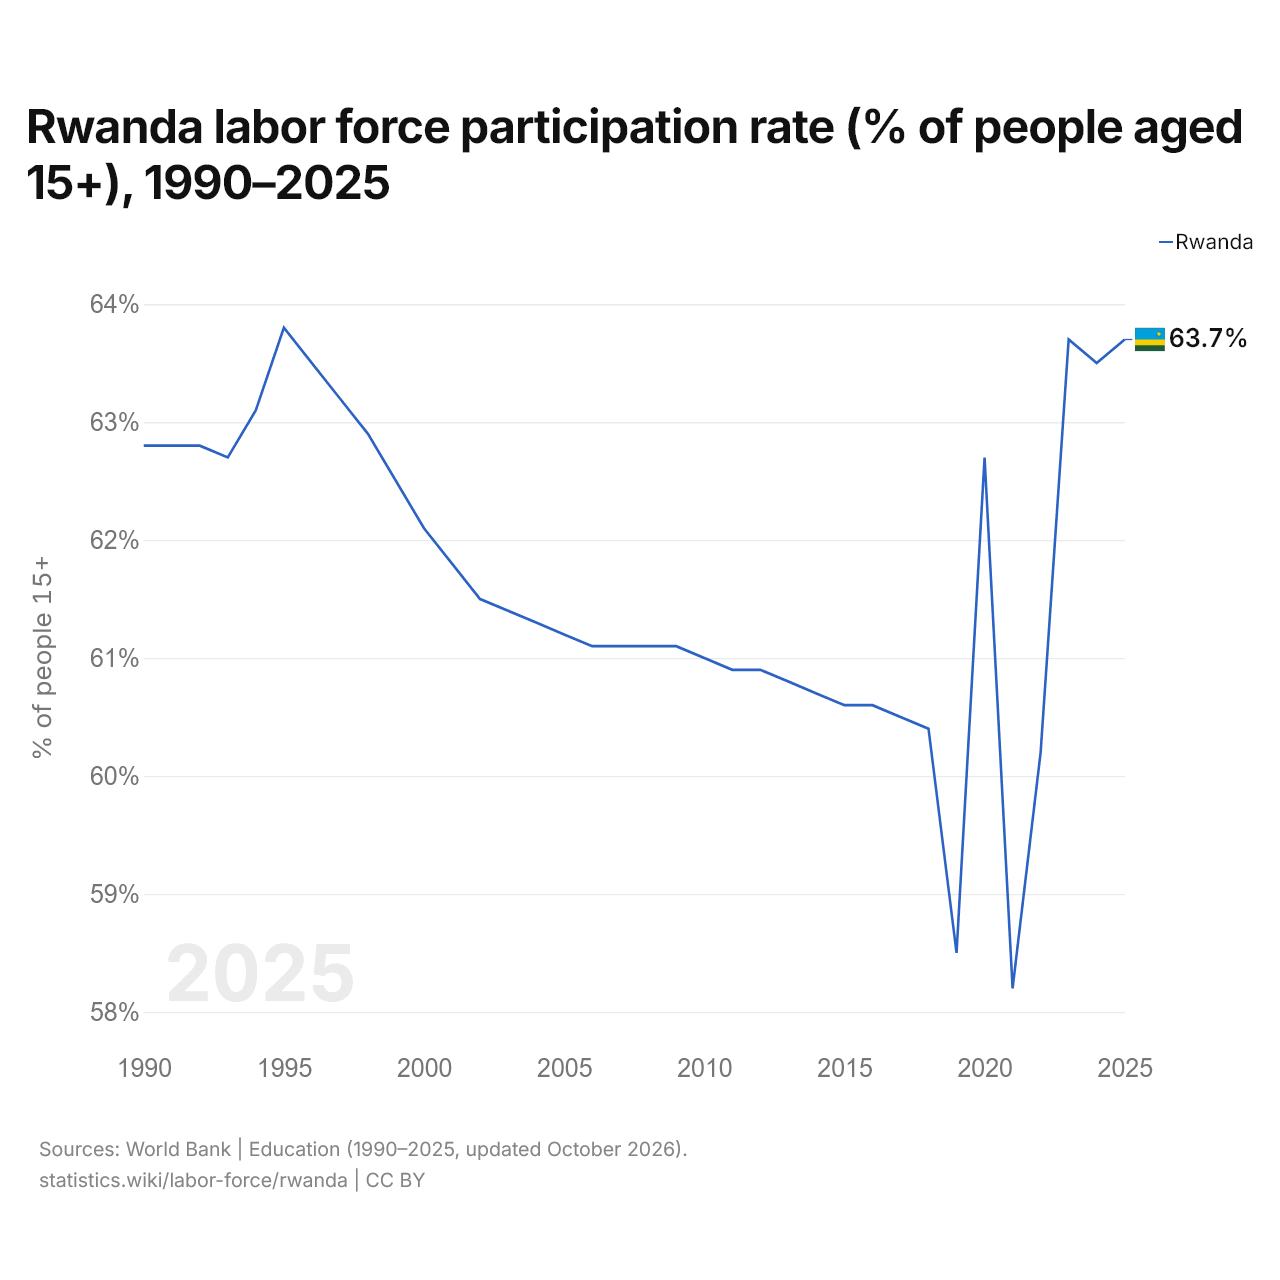
In 2025, Rwanda's labor force participation rate was 63.7% of people aged 15 and over, up from 62.8% in 1990. It was highest in 1995, at 63.8%.
The largest ten-year rise in Rwanda's labor force participation rate was from 2010 to 2020, by 1.7 percentage points; the largest ten-year fall was from 2000 to 2010, by 1.1 points.
Rwanda in the world labor force ranking, 2025
| Rank | Country | Labor force | Share of world | Participation rate | |
|---|---|---|---|---|---|
| 75 |
 Benin |
6.64M | 0.18% | 76.4% | vs Benin |
| 76 |
 Burundi |
6.31M | 0.17% | 78.3% | vs Burundi |
| 77 |
 Senegal |
6.13M | 0.16% | 52.0% | |
| 78 |
Rwanda |
5.84M | 0.16% | 63.7% | |
| 79 |
 Sweden |
5.7M | 0.15% | 64.6% | |
| 80 |
 Czech Republic |
5.58M | 0.15% | 60.3% | |
| 81 |
 Dominican Republic |
5.51M | 0.15% | 64.8% |
Compare Rwanda labor force with other countries
Sources:
- World Bank | Education (1990–2025, updated October 2026)
Creative Commons Attribution (CC BY): you may copy, share, adapt and reuse this content, also commercially, as long as you credit statistics.wiki and note any changes you made. The sources listed above may have their own license terms.