
World forest area, with % of land area and area per person
| World forest area, 2024 | 15,945,856 mi² |
|---|---|
| World forest area, % of land area, 2024 | 32.0% |
| World forest area per person, 2024 | 1.26 acres per person |
The world has 15,945,856 mi² (41,299,576 km²) of forest, 32.0% of its land area. Since 1990, the forest area has shrunk in 87 countries and grown in 81.
Forest area is land of more than half a hectare with trees taller than 5 meters covering more than a tenth of it, or trees able to reach that, as FAO counts it in its Global Forest Resources Assessments: planted forests are included, while orchards, oil palm plantations and trees in cities and parks are not. The share is the forest area divided by the country's land area, without its inland waters.
List of countries by forest area, with % of land area and change since 1990
| Rank | Country | Forest area, mi² | % of land area | Forest area, acres per person | Net change since 1990 |
|---|---|---|---|---|---|
| 1 |  Russia |
3,211,561 | 50.8% | 14.3 | +2.5% since 1992 |
| 2 |  Brazil |
1,889,363 | 58.5% | 5.7 | −20.9% |
| 3 |  Canada |
1,424,055 | 42.0% | 22.1 | +2.2% |
| 4 |  United States |
1,192,928 | 33.8% | 2.25 | +2.2% |
| 5 |  China |
870,823 | 24.0% | 0.4 | +43.5% |
| 6 |  DR Congo |
538,504 | 61.5% | 3.15 | −13.1% |
| 7 |  Australia |
515,475 | 17.4% | 12.1 | −0.8% |
| 8 |  Indonesia |
370,225 | 50.7% | 0.84 | −17.6% |
| 9 |  India |
280,515 | 24.4% | 0.12 | +13.6% |
| 10 |  Peru |
260,461 | 52.7% | 4.87 | −12.4% |
| 11 |  Mexico |
256,346 | 34.2% | 1.25 | −7.5% |
| 12 |  Angola |
246,226 | 51.2% | 4.16 | −17.7% |
| 13 |  Colombia |
230,079 | 53.7% | 2.78 | −8.5% |
| 14 |  Bolivia |
210,851 | 50.2% | 10.9 | −11.6% |
| 15 |  Venezuela |
181,999 | 53.4% | 4.1 | −6.6% |
| 16 |  Argentina |
180,609 | 17.1% | 2.53 | −16.5% |
| 17 |  CAR |
174,292 | 72.5% | 20.9 | −2.8% |
| 18 |  Zambia |
173,636 | 60.5% | 5.21 | −5.1% |
| 19 |  Tanzania |
169,379 | 49.6% | 1.58 | −24.6% |
| 20 |  Papua New Guinea |
131,401 | 75.2% | 7.95 | −1.7% |
| 21 |  Mozambique |
125,522 | 41.3% | 2.32 | −21.8% |
| 22 |  Sweden |
107,854 | 68.6% | 6.53 | −0.5% |
| 23 |  Myanmar |
105,734 | 42.0% | 1.24 | −30.2% |
| 24 |  Ethiopia |
103,286 | 23.8% | 0.5 | −5.5% since 1993 |
| 25 |  Japan |
96,179 | 68.3% | 0.5 | −0.2% |
| 26 |  Gabon |
90,974 | 91.4% | 22.9 | −0.9% |
| 27 |  South Africa |
88,008 | 18.8% | 0.88 | +15.0% |
| 28 |  Turkey |
87,601 | 29.5% | 0.66 | +14.7% |
| 29 |  Finland |
87,039 | 74.2% | 9.91 | +3.1% |
| 30 |  Sudan |
85,539 | 11.9% | 1.09 | −8.6% since 2012 |
| 31 |  Congo |
84,324 | 64.0% | 8.52 | −1.9% |
| 32 |  Thailand |
76,392 | 38.7% | 0.68 | −2.2% |
| 33 |  Cameroon |
74,364 | 40.7% | 1.63 | −14.4% |
| 34 |  Spain |
73,756 | 38.2% | 0.97 | +37.4% |
| 35 |  Malaysia |
73,146 | 57.7% | 1.32 | −8.1% |
| 36 |  Guyana |
70,984 | 87.1% | 54.7 | −1.2% |
| 37 |  Chile |
70,142 | 24.5% | 2.27 | +8.1% |
| 38 |  France |
68,362 | 32.9% | 0.64 | +22.6% |
| 39 |  Nigeria |
66,629 | 18.9% | 0.18 | −20.0% |
| 40 |  Botswana |
60,735 | 27.8% | 15.4 | 0% |
| 41 |  Vietnam |
57,018 | 47.1% | 0.36 | +57.5% |
| 42 |  Suriname |
56,728 | 91.5% | 57.2 | −1.2% |
| 43 |  Paraguay |
55,835 | 36.5% | 5.16 | −43.7% |
| 44 |  Mongolia |
54,743 | 9.1% | 9.94 | −1.2% |
| 45 |  Zimbabwe |
53,355 | 35.7% | 2.05 | −17.3% |
| 46 |  Laos |
50,469 | 56.6% | 4.16 | −9.2% |
| 47 |  Ecuador |
47,647 | 49.7% | 1.68 | −15.7% |
| 48 |  Norway |
46,761 | 33.2% | 5.37 | −0.9% |
| 49 |  Germany |
44,311 | 32.8% | 0.34 | +1.6% |
| 50 |  Iran |
41,510 | 6.6% | 0.29 | 0% |
| 51 |  Mali |
40,849 | 8.7% | 1.07 | −24.4% |
| 52 |  New Zealand |
39,519 | 38.9% | 4.78 | +9.2% |
| 53 |  Ukraine |
38,811 | 17.3% | 0.66 | +7.8% since 1992 |
| 54 |  Madagascar |
38,789 | 17.3% | 0.78 | −26.5% |
| 55 |  Poland |
36,637 | 31.0% | 0.64 | +6.8% |
| 56 |  Italy |
36,330 | 31.8% | 0.39 | +24.0% |
| 57 |  Belarus |
34,552 | 44.1% | 2.42 | +13.6% since 1992 |
| 58 |  Senegal |
33,455 | 45.0% | 1.16 | −5.7% |
| 59 |  Namibia |
31,057 | 9.8% | 6.56 | −8.3% |
| 60 |  North Korea |
29,794 | 64.1% | 0.72 | +3.5% |
| 61 |  Philippines |
28,557 | 24.8% | 0.16 | −4.9% |
| 62 |  South Sudan |
27,639 | 11.3% | 1.48 | +0.2% since 2012 |
| 63 |  Ghana |
27,107 | 30.9% | 0.5 | +20.9% |
| 64 |  Romania |
26,840 | 30.2% | 0.9 | +9.1% |
| 65 |  Cambodia |
25,645 | 37.6% | 0.93 | −39.6% |
| 66 |  Liberia |
24,584 | 66.1% | 2.8 | −20.5% |
| 67 |  South Korea |
24,258 | 64.4% | 0.3 | −4.1% |
| 68 |  Nepal |
24,130 | 43.6% | 0.52 | +8.7% |
| 69 |  Honduras |
22,825 | 52.8% | 1.35 | −22.7% |
| 70 |  Morocco |
21,989 | 12.8% | 0.37 | −0.1% |
| 71 |  Guinea |
19,013 | 20.0% | 0.82 | −31.6% |
| 72 |  Somalia |
18,941 | 7.8% | 0.64 | −40.8% |
| 73 |  Greece |
18,389 | 36.9% | 1.13 | +28.4% |
| 74 |  Panama |
17,829 | 62.2% | 2.53 | −6.8% |
| 75 |  Bulgaria |
15,237 | 36.4% | 1.51 | +18.6% |
| 76 |  Austria |
15,062 | 47.3% | 1.05 | +3.3% |
| 77 |  Ivory Coast |
14,884 | 12.1% | 0.3 | −53.5% |
| 78 |  Uzbekistan |
14,877 | 8.8% | 0.26 | +46.4% since 1992 |
| 79 |  Kenya |
14,862 | 6.6% | 0.17 | +2.9% |
| 80 |  Chad |
14,437 | 3.0% | 0.46 | −44.4% |
| 81 |  Cuba |
13,978 | 34.9% | 0.81 | +56.6% |
| 82 |  Guatemala |
13,702 | 33.1% | 0.48 | −26.9% |
| 83 |  Kazakhstan |
13,539 | 1.3% | 0.42 | +10.9% since 1992 |
| 84 |  Latvia |
13,361 | 55.6% | 4.58 | +8.6% since 1992 |
| 85 |  Serbia |
13,265 | 39.2% | 1.29 | +26.2% since 2006 |
| 86 |  Portugal |
12,961 | 36.6% | 0.78 | −2.4% |
| 87 |  Burkina Faso |
12,961 | 12.3% | 0.35 | −59.6% |
| 88 |  United Kingdom |
12,608 | 13.5% | 0.12 | +17.5% |
| 89 |  Pakistan |
12,246 | 4.1% | 0.03 | −8.4% |
| 90 |  Benin |
12,242 | 28.1% | 0.54 | −54.6% |
| 91 |  Nicaragua |
11,998 (2023) | 25.8% (2023) | 1.13 (2023) | −56.2% |
| 92 |  Georgia |
11,971 | 44.6% | 2.01 | +2.3% since 1992 |
| 93 |  Costa Rica |
11,529 | 59.1% | 1.44 | +8.2% |
| 94 |  Czech Republic |
11,426 | 38.4% | 0.67 | +3.9% since 1993 |
| 95 |  Saudi Arabia |
10,711 | 1.3% | 0.19 | +0.2% |
| 96 |  Bhutan |
10,360 | 70.4% | 8.38 | +7.0% |
| 97 |  Solomon Islands |
9,709 | 89.8% | 7.59 | −1.0% |
| 98 |  Sierra Leone |
9,483 | 34.0% | 0.7 | −21.5% |
| 99 |  Estonia |
9,445 | 57.2% | 4.4 | +10.6% since 1992 |
| 100 |  Equatorial Guinea |
9,324 | 86.1% | 3.15 | −10.5% |
| 101 |  Uganda |
9,250 | 11.9% | 0.12 | −47.3% |
| 102 |  Turkmenistan |
8,996 | 5.0% | 0.77 | 0% since 1992 |
| 103 |  Dominican Republic |
8,691 | 46.7% | 0.49 | +5.6% |
| 104 |  Lithuania |
8,546 | 35.4% | 1.89 | +12.9% since 1992 |
| 105 |  Taiwan |
8,483 (2023) | 60.8% (2023) | 0.23 (2023) | +4.5% since 2011 |
| 106 |  Bosnia |
8,344 | 42.2% | 1.69 | −1.3% since 1992 |
| 107 |  Sri Lanka |
8,207 | 34.4% | 0.24 | −10.3% |
| 108 |  Guinea-Bissau |
8,123 | 74.8% | 2.36 | −6.8% |
| 109 |  Hungary |
8,036 | 22.8% | 0.54 | +14.7% |
| 110 |  Malawi |
8,007 | 22.0% | 0.24 | −40.8% |
| 111 |  Uruguay |
7,744 | 11.5% | 1.46 | +128.1% |
| 112 |  Croatia |
7,509 | 34.8% | 1.24 | +4.7% since 1992 |
| 113 |  Slovakia |
7,485 | 40.3% | 0.88 | +1.9% since 1993 |
| 114 |  Bangladesh |
7,237 | 14.4% | 0.03 | −5.6% |
| 115 |  Algeria |
6,533 | 0.7% | 0.09 | −1.3% |
| 116 |  Eritrea |
5,591 | 12.0% | 1.01 | −11.3% since 1993 |
| 117 |  Belize |
5,107 | 58.0% | 7.84 | −16.3% |
| 118 |  Switzerland |
4,885 | 32.0% | 0.35 | +9.7% |
| 119 |  Kyrgyzstan |
4,847 | 6.5% | 0.43 | +9.6% since 1992 |
| 120 |  Slovenia |
4,802 | 61.8% | 1.44 | +3.9% since 1992 |
| 121 |  Togo |
4,716 | 22.5% | 0.36 | −5.9% |
| 122 |  Afghanistan |
4,670 | 1.9% | 0.07 | 0% |
| 123 |  Azerbaijan |
4,645 | 14.6% | 0.29 | +26.2% since 1992 |
| 124 |  Fiji |
4,371 | 61.7% | 3.01 | +20.5% |
| 125 |  Niger |
4,093 | 0.8% | 0.1 | −45.5% |
| 126 |  East Timor |
4,074 | 71.0% | 1.86 | −4.1% |
| 127 |  North Macedonia |
3,974 | 40.8% | 1.39 | +11.7% since 1992 |
| 128 |  Mauritania |
3,925 | 1.0% | 0.49 | +9.6% |
| 129 |  Albania |
3,633 | 34.3% | 0.98 | +19.3% |
| 130 |  Vanuatu |
3,513 | 74.6% | 6.86 | −8.2% |
| 131 |  Montenegro |
3,193 | 61.5% | 3.28 | +10.8% since 2006 |
| 132 |  Ireland |
3,185 | 12.0% | 0.38 | +78.7% |
| 133 |  Iraq |
2,699 | 1.6% | 0.04 | −13.0% |
| 134 |  Tunisia |
2,663 | 4.4% | 0.14 | +7.1% |
| 135 |  El Salvador |
2,641 | 33.0% | 0.27 | −7.0% |
| 136 |  Belgium |
2,589 | 22.0% | 0.14 | +0.5% since 2000 |
| 137 |  Denmark |
2,473 | 16.0% | 0.26 | +20.5% |
| 138 |  Rwanda |
2,394 | 26.1% | 0.11 | +41.9% |
| 139 |  Jamaica |
2,365 | 56.5% | 0.53 | +17.5% |
| 140 |  Yemen |
2,120 | 1.0% | 0.03 | 0% |
| 141 |  Syria |
2,038 | 2.9% | 0.05 | +17.0% |
| 142 |  Bahamas |
1,969 | 50.9% | 3.14 | 0% |
| 143 |  Eswatini |
1,678 | 25.3% | 0.86 | −10.5% |
| 144 |  Tajikistan |
1,638 | 3.1% | 0.1 | +3.9% since 1992 |
| 145 |  Brunei |
1,467 | 72.1% | 2.03 | −8.0% |
| 146 |  Moldova |
1,432 | 11.3% | 0.38 | +12.7% since 1992 |
| 147 |  Haiti |
1,431 | 13.5% | 0.08 | +0.4% |
| 148 |  Netherlands |
1,424 | 11.0% | 0.05 | +6.8% |
| 149 |  Armenia |
1,290 | 11.8% | 0.27 | −0.1% since 1992 |
| 150 |  UAE |
1,252 | 4.6% | 0.07 | +3.0% |
| 151 |  Burundi |
1,080 | 10.9% | 0.05 | +1.1% |
| 152 |  Trinidad |
874 | 44.2% | 0.41 | −6.0% |
| 153 |  Gambia |
834 | 21.3% | 0.19 | −47.9% |
| 154 |  Libya |
794 | 0.1% | 0.07 | −5.2% |
| 155 |  Cyprus |
664 | 18.6% | 0.31 | +6.7% |
| 156 |  Samoa |
619 | 57.6% | 1.82 | −9.3% |
| 157 |  Israel |
571 | 6.8% | 0.04 | +12.1% |
| 158 |  Lebanon |
545 | 13.8% | 0.06 | +2.4% |
| 159 |  Luxembourg |
342 | 34.5% | 0.32 | +2.3% since 2000 |
| 160 |  Jordan |
273 | 0.8% | 0.02 | 0% |
| 161 |  Iceland |
233.7 | 0.6% | 0.39 | +237.5% |
| 162 |  Dominica |
221.6 | 76.4% | 2.14 | −2.4% |
| 163 |  Sao Tome |
213.3 | 57.6% | 0.58 | −6.5% |
| 164 |  Cape Verde |
194.7 | 12.5% | 0.24 | +50.6% |
| 165 |  Palau |
161.3 | 90.8% | 5.83 | +9.1% since 1991 |
| 166 |  Mauritius |
147.8 | 19.1% | 0.08 | −6.8% |
| 167 |  Lesotho |
133.3 | 1.1% | 0.04 | 0% |
| 168 |  Comoros |
128.5 | 17.8% | 0.09 | −29.5% |
| 169 |  Saint Lucia |
126.6 | 53.8% | 0.45 | +21.2% |
| 170 |  Saint Vincent |
110.3 | 73.4% | 0.7 | +0.1% |
| 171 |  Seychelles |
103.2 | 58.5% | 0.54 | −21.7% |
| 172 |  Andorra |
70.3 | 38.9% | 0.55 | +2.9% |
| 173 |  Grenada |
68.3 | 51.5% | 0.37 | 0% |
| 174 |  Singapore |
61 | 21.8% | 0.006 | +6.5% |
| 175 |  Cayman Islands |
49.1 | 53.0% | 0.42 | −3.1% |
| 176 |  Palestine |
42.9 | 1.8% | 0.005 | +22.2% |
| 177 |  Saint Kitts |
42.5 | 42.1% | 0.58 | 0% |
| 178 |  Marshall Islands |
37.5 | 53.6% | 0.64 | +3.3% since 1991 |
| 179 |  Tonga |
33.7 | 12.1% | 0.21 | 0% |
| 180 |  Antigua |
30.3 | 17.9% | 0.21 | −22.3% |
| 181 |  Barbados |
24.3 | 14.6% | 0.06 | 0% |
| 181 |  Kuwait |
24.3 | 0.4% | 0.003 | +82.6% |
| 183 |  Djibouti |
22.9 | 0.3% | 0.01 | +5.7% |
| 184 |  Liechtenstein |
22.7 | 36.8% | 0.36 | +13.3% |
| 185 |  Egypt |
15.8 | 0.0% | 0.00009 | +4.9% |
| 186 |  Bahrain |
15 | 4.9% | 0.006 | +183.9% |
| 187 |  Maldives |
14.4 | 12.5% | 0.02 | 0% |
| 188 |  Oman |
6.18 | 0.0% | 0.0007 | 0% |
| 189 |  Qatar |
5.41 | 0.1% | 0.001 | 0% |
| 190 |  Kiribati |
4.13 | 1.3% | 0.02 | 0% |
| 191 |  Tuvalu |
3.98 | 39.6% | 0.26 | 0% |
| 192 |  San Marino |
3.86 | 16.3% | 0.07 | 0% |
| 193 |  Malta |
1.81 | 1.5% | 0.002 | +34.3% |
| 194 |  Curacao |
0.27 | 0.2% | 0.001 | 0% since 2011 |
| 195 |  Monaco |
0 (2023) | 0.0% (2023) | 0 (2023) | 0% |
| 195 |  Nauru |
0 (2023) | 0.0% (2023) | 0 (2023) | 0% |
The list ranks 196 countries by their latest forest area, from Russia, which has 3,211,561 mi² (8,317,904 km²) of forest, to Nauru, which has none.
10 most forested countries by % of land area
10 least forested countries by % of land area
Suriname has the largest share of its land under forest, 91.5%, and Nauru the smallest, 0.0%. Of the ten most forested countries, four are in Oceania; of the ten least forested, three are in Africa.
Forest area by country map, % of land area
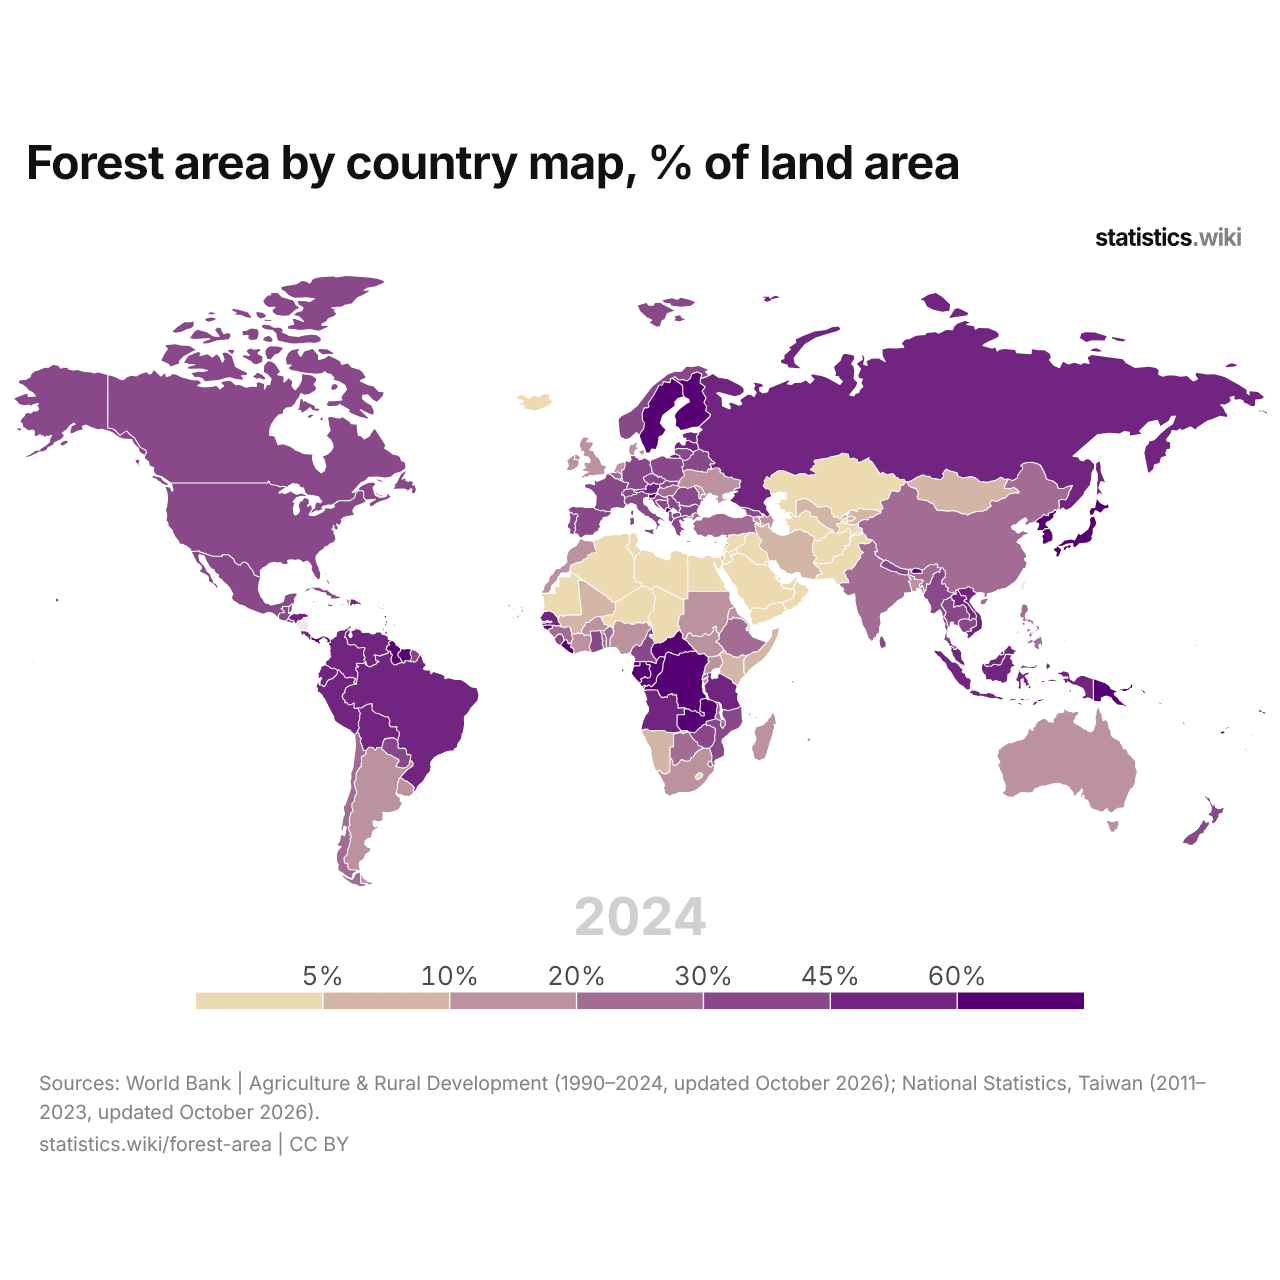
Forest covers more than 60% of the land in 28 countries and less than 10% in 38; in 1990, the numbers were 39 and 34.
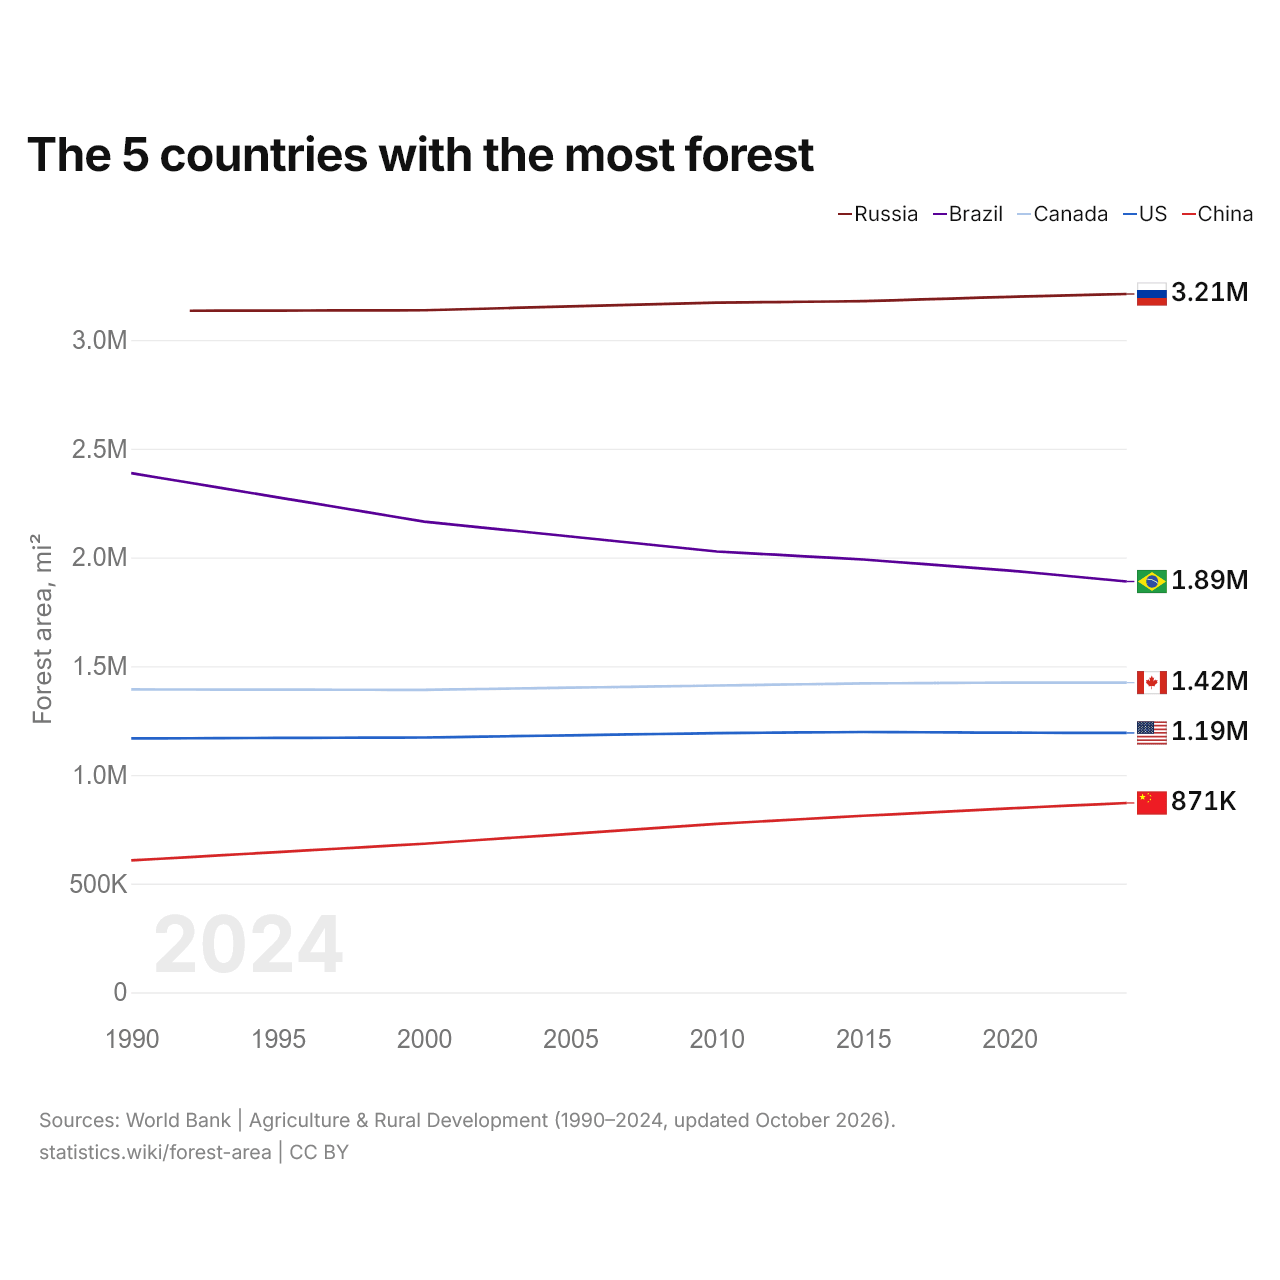
The 5 countries with the most forest
| Year | Forest area, mi² | ||||
|---|---|---|---|---|---|
| Russia | Brazil | Canada | United States | China | |
| 2024 | 3,211,561 | 1,889,363 | 1,424,056 | 1,192,928 | 870,823 |
| 2023 | 3,208,319 | 1,901,934 | 1,424,093 | 1,193,206 | 864,602 |
| 2022 | 3,205,078 | 1,914,506 | 1,424,131 | 1,193,484 | 858,382 |
| 2021 | 3,201,836 | 1,927,078 | 1,424,169 | 1,193,762 | 852,162 |
| 2020 | 3,198,595 | 1,939,649 | 1,424,207 | 1,194,040 | 845,942 |
| 2019 | 3,194,559 | 1,949,798 | 1,423,532 | 1,194,689 | 839,144 |
| 2018 | 3,190,524 | 1,959,946 | 1,422,857 | 1,195,338 | 832,346 |
| 2017 | 3,186,488 | 1,970,094 | 1,422,183 | 1,195,986 | 825,547 |
| 2016 | 3,182,452 | 1,980,243 | 1,421,508 | 1,196,635 | 818,749 |
| 2015 | 3,178,417 | 1,990,391 | 1,420,833 | 1,197,283 | 811,951 |
| 2014 | 3,177,101 | 1,997,788 | 1,418,854 | 1,196,222 | 804,473 |
| 2013 | 3,175,785 | 2,005,184 | 1,416,875 | 1,195,160 | 796,995 |
| 2012 | 3,174,469 | 2,012,581 | 1,414,896 | 1,194,098 | 789,517 |
| 2011 | 3,173,153 | 2,019,977 | 1,412,917 | 1,193,036 | 782,039 |
| 2010 | 3,171,837 | 2,027,374 | 1,410,937 | 1,191,975 | 774,561 |
| 2009 | 3,168,340 | 2,041,132 | 1,408,958 | 1,189,973 | 765,445 |
| 2008 | 3,164,843 | 2,054,890 | 1,406,979 | 1,187,971 | 756,329 |
| 2007 | 3,161,347 | 2,068,648 | 1,405,000 | 1,185,970 | 747,213 |
| 2006 | 3,157,850 | 2,082,406 | 1,403,021 | 1,183,968 | 738,098 |
| 2005 | 3,154,353 | 2,096,164 | 1,401,042 | 1,181,967 | 728,982 |
| 2004 | 3,150,856 | 2,109,922 | 1,399,062 | 1,179,965 | 719,866 |
| 2003 | 3,147,359 | 2,123,680 | 1,397,083 | 1,177,964 | 710,750 |
| 2002 | 3,143,863 | 2,137,438 | 1,395,104 | 1,175,962 | 701,634 |
| 2001 | 3,140,366 | 2,151,196 | 1,393,125 | 1,173,961 | 692,519 |
| 2000 | 3,136,869 | 2,164,954 | 1,391,145 | 1,171,959 | 683,403 |
| 1999 | 3,136,559 | 2,187,241 | 1,391,328 | 1,171,540 | 675,735 |
| 1998 | 3,136,248 | 2,209,528 | 1,391,510 | 1,171,120 | 668,067 |
| 1997 | 3,135,938 | 2,231,814 | 1,391,692 | 1,170,701 | 660,399 |
| 1996 | 3,135,627 | 2,254,101 | 1,391,875 | 1,170,282 | 652,731 |
| 1995 | 3,135,317 | 2,276,388 | 1,392,057 | 1,169,863 | 645,063 |
| 1994 | 3,135,006 | 2,298,675 | 1,392,240 | 1,169,443 | 637,395 |
| 1993 | 3,134,696 | 2,320,962 | 1,392,422 | 1,169,024 | 629,727 |
| 1992 | 3,134,385 | 2,343,249 | 1,392,604 | 1,168,605 | 622,059 |
| 1991 | - | 2,365,536 | 1,392,787 | 1,168,185 | 614,391 |
| 1990 | - | 2,387,823 | 1,392,969 | 1,167,766 | 606,723 |
Of all countries, Russia has the most forest, 3,211,561 mi² (8,317,904 km²), followed by Brazil with 1,889,363 mi² (4,893,427 km²), Canada with 1,424,056 mi² (3,688,287 km²), the United States with 1,192,928 mi² (3,089,670 km²) and China with 870,823 mi² (2,255,420 km²). Russia's forest has been the largest of the five every year since 1992.
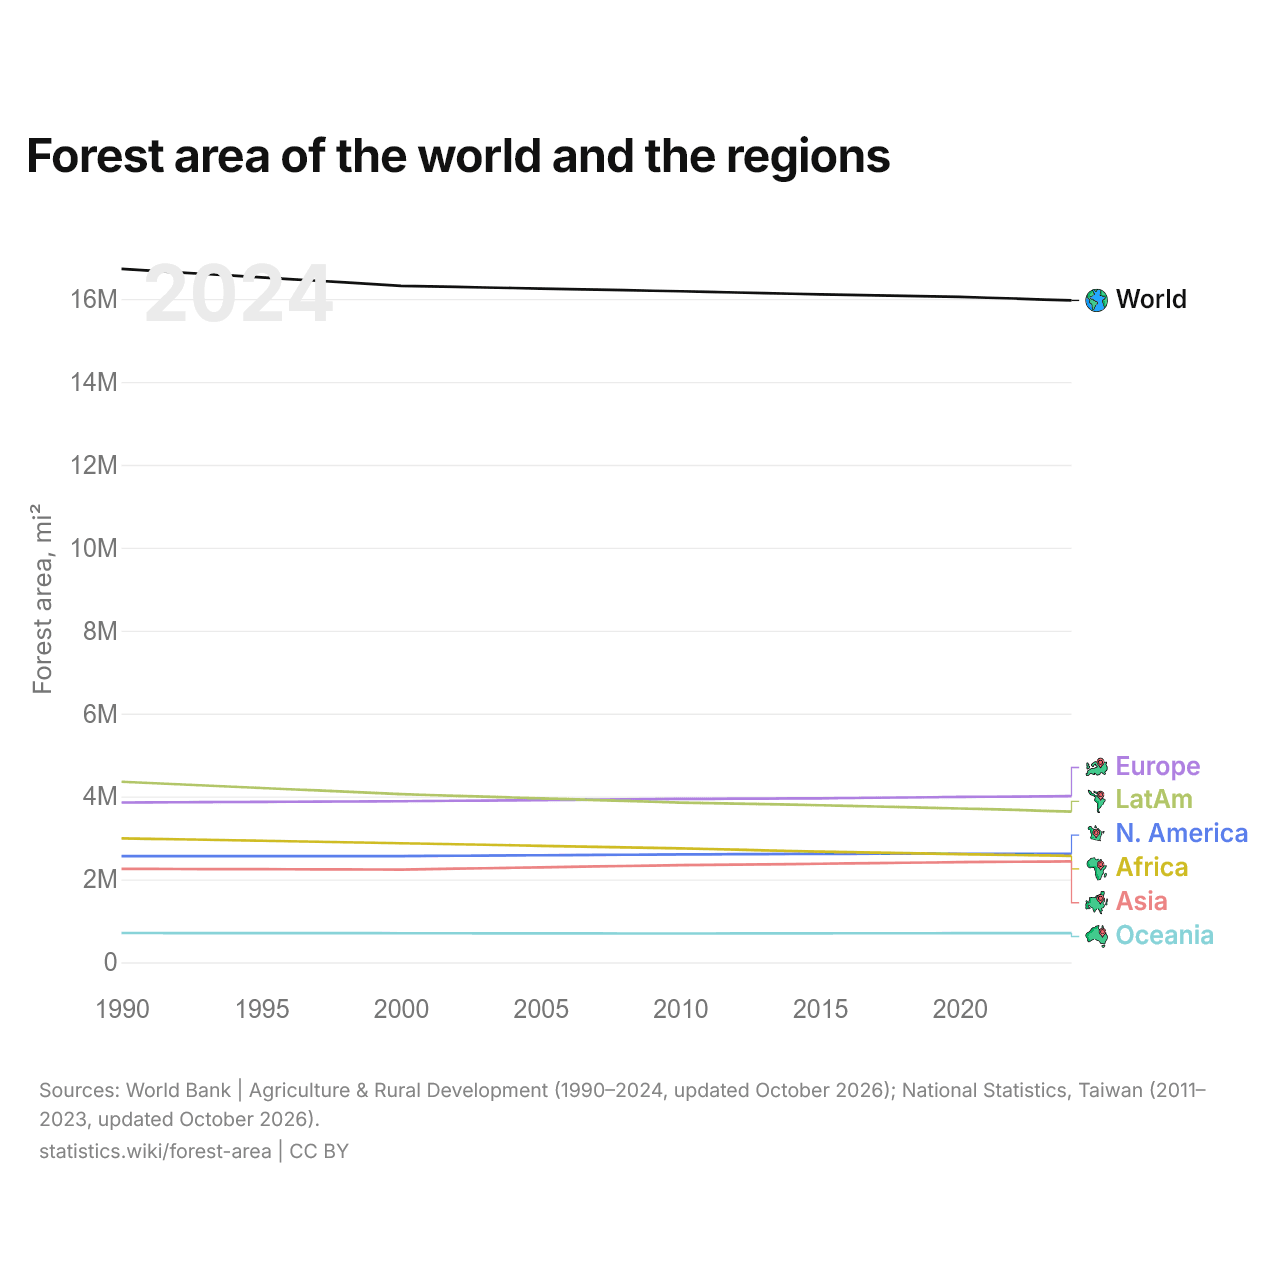
Forest area of the world and the regions
| Year | Forest area, mi² | ||||||
|---|---|---|---|---|---|---|---|
| World | Europe | Latin America | North America | Africa | Asia | Oceania | |
| 2024 | 15,966,337 | 4,007,416 | 3,634,398 | 2,616,984 | 2,567,027 | 2,435,664 | 704,848 |
| 2023 | 15,985,539 | 4,002,930 | 3,651,955 | 2,617,300 | 2,578,012 | 2,430,954 | 704,388 |
| 2022 | 16,011,457 | 3,998,443 | 3,676,228 | 2,617,615 | 2,588,997 | 2,426,244 | 703,929 |
| 2021 | 16,030,744 | 3,993,957 | 3,693,871 | 2,617,931 | 2,599,982 | 2,421,534 | 703,469 |
| 2020 | 16,050,031 | 3,989,470 | 3,711,513 | 2,618,247 | 2,610,967 | 2,416,824 | 703,010 |
| 2019 | 16,062,501 | 3,982,874 | 3,727,189 | 2,618,221 | 2,622,837 | 2,408,990 | 702,390 |
| 2018 | 16,074,971 | 3,976,278 | 3,742,865 | 2,618,195 | 2,634,707 | 2,401,157 | 701,770 |
| 2017 | 16,087,441 | 3,969,682 | 3,758,541 | 2,618,169 | 2,646,578 | 2,393,323 | 701,150 |
| 2016 | 16,099,912 | 3,963,085 | 3,774,217 | 2,618,143 | 2,658,448 | 2,385,489 | 700,529 |
| 2015 | 16,112,382 | 3,956,489 | 3,789,893 | 2,618,117 | 2,670,318 | 2,377,656 | 699,910 |
| 2014 | 16,127,161 | 3,953,455 | 3,802,686 | 2,615,076 | 2,686,274 | 2,370,778 | 698,892 |
| 2013 | 16,142,308 | 3,950,421 | 3,815,479 | 2,612,035 | 2,702,229 | 2,364,268 | 697,875 |
| 2012 | 16,157,455 | 3,947,387 | 3,828,273 | 2,608,994 | 2,718,185 | 2,357,759 | 696,858 |
| 2011 | 16,171,946 | 3,944,353 | 3,841,066 | 2,605,953 | 2,733,484 | 2,351,250 | 695,840 |
| 2010 | 16,186,437 | 3,941,319 | 3,853,859 | 2,602,912 | 2,748,783 | 2,344,740 | 694,823 |
| 2009 | 16,199,520 | 3,935,655 | 3,874,096 | 2,598,931 | 2,761,192 | 2,334,076 | 695,569 |
| 2008 | 16,212,601 | 3,929,991 | 3,894,333 | 2,594,951 | 2,773,601 | 2,323,411 | 696,315 |
| 2007 | 16,225,684 | 3,924,327 | 3,914,569 | 2,590,970 | 2,786,010 | 2,312,747 | 697,061 |
| 2006 | 16,238,766 | 3,918,664 | 3,934,806 | 2,586,989 | 2,798,419 | 2,302,083 | 697,807 |
| 2005 | 16,252,081 | 3,913,231 | 3,955,042 | 2,583,008 | 2,810,828 | 2,291,419 | 698,553 |
| 2004 | 16,265,393 | 3,907,797 | 3,975,279 | 2,579,028 | 2,823,237 | 2,280,754 | 699,299 |
| 2003 | 16,278,706 | 3,902,365 | 3,995,515 | 2,575,047 | 2,835,645 | 2,270,090 | 700,045 |
| 2002 | 16,292,020 | 3,896,931 | 4,015,752 | 2,571,066 | 2,848,054 | 2,259,425 | 700,791 |
| 2001 | 16,305,333 | 3,891,498 | 4,035,988 | 2,567,085 | 2,860,463 | 2,248,761 | 701,537 |
| 2000 | 16,318,646 | 3,886,065 | 4,056,225 | 2,563,104 | 2,872,872 | 2,238,096 | 702,283 |
| 1999 | 16,359,340 | 3,882,956 | 4,086,122 | 2,562,868 | 2,884,833 | 2,239,748 | 702,814 |
| 1998 | 16,400,034 | 3,879,846 | 4,116,019 | 2,562,631 | 2,896,794 | 2,241,399 | 703,345 |
| 1997 | 16,440,729 | 3,876,737 | 4,145,916 | 2,562,394 | 2,908,756 | 2,243,050 | 703,877 |
| 1996 | 16,481,423 | 3,873,627 | 4,175,812 | 2,562,157 | 2,920,717 | 2,244,701 | 704,408 |
| 1995 | 16,522,118 | 3,870,519 | 4,205,709 | 2,561,920 | 2,932,679 | 2,246,353 | 704,940 |
| 1994 | 16,562,812 | 3,867,409 | 4,235,606 | 2,561,683 | 2,944,640 | 2,248,004 | 705,471 |
| 1993 | 16,603,506 | 3,864,299 | 4,265,503 | 2,561,446 | 2,956,602 | 2,249,655 | 706,002 |
| 1992 | 16,643,906 | 3,861,199 | 4,295,399 | 2,561,209 | 2,968,259 | 2,251,306 | 706,533 |
| 1991 | 16,685,177 | 3,858,777 | 4,325,296 | 2,560,972 | 2,979,916 | 2,253,151 | 707,065 |
| 1990 | 16,726,448 | 3,856,355 | 4,355,193 | 2,560,735 | 2,991,573 | 2,254,996 | 707,597 |
Europe has 25% of the world's forest, Latin America 23% and North America 16%. In 1990, Europe's share was 23%, Latin America's 26% and North America's 15%. Europe's forest has been the largest of the regions since 2007. The world's forest area has shrunk from 16,726,448 mi² (43,321,302 km²) in 1990 to 15,966,337 mi² (41,352,623 km²).
Compare the forest area of any 2 countries
Sources:
- World Bank | Agriculture & Rural Development (1990–2024, updated October 2026)
- National Statistics, Taiwan (2011–2023, updated October 2026)
- U.S. Census Bureau (2024, updated October 2026)
Creative Commons Attribution (CC BY): you may copy, share, adapt and reuse this content, also commercially, as long as you credit statistics.wiki and note any changes you made. The sources listed above may have their own license terms.