
World net forest loss per year since 1990
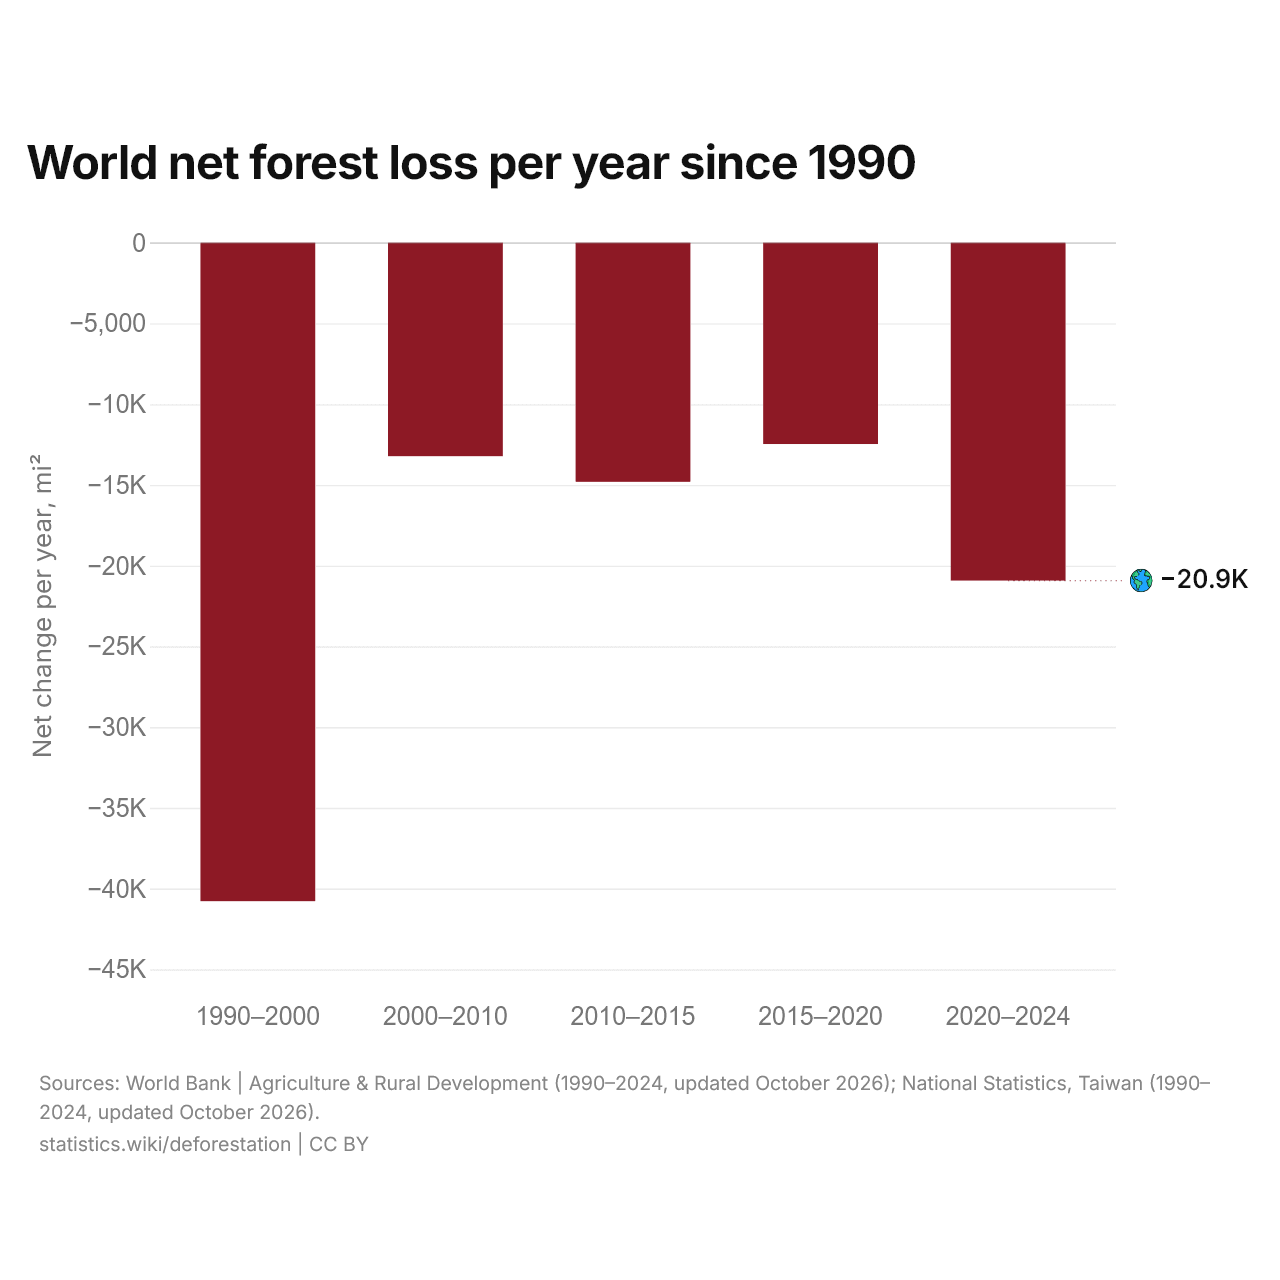
| World net forest change, 2020–2024 | −20,924 mi² a year (−0.13%) |
|---|---|
| World net forest change, 1990–2024 | −760,112 mi² (−4.5%) |
| World forest area, 2024 | 15,945,856 mi² |
| Period | Net change per year, mi² |
|---|---|
| World | |
| 1990–2000 | −40,780 |
| 2000–2010 | −13,221 |
| 2010–2015 | −14,811 |
| 2015–2020 | −12,470 |
| 2020–2024 | −20,924 |
The world's forest area shrinks by 20,924 mi² (54,192 km²), or 5.42 million hectares, a year. In 1990–2000, it shrank by 40,780 mi² (105,620 km²) a year. Since 1990, it has shrunk by 760,112 mi² (1,968,680 km²), or 4.5%. Over the same years, the forest area has shrunk in 87 countries and grown in 81.
Deforestation here is the net change of a country's forest area: the forest that is cleared or lost, minus the forest that grows back or is planted. A small net change can hide large clearing balanced by new plantations elsewhere in the country. The forest areas come from FAO's Global Forest Resources Assessments, which report the changes for the periods 1990–2000, 2000–2010, 2010–2015, 2015–2020 and since 2020; the pages compare each country's latest area with its area in 1990.
List of countries by net forest change since 1990 and per year
| Rank | Country | Since 1990, mi² | Since 1990, % | Per year, 2020–2024, mi² | Per year, 2020–2024, % |
|---|---|---|---|---|---|
| 1 |  Brazil |
−498,460 | −20.9% | −12,572 | −0.65% |
| 2 |  DR Congo |
−81,345 | −13.1% | −1,092 | −0.20% |
| 3 |  Indonesia |
−78,945 | −17.6% | +315 | +0.09% |
| 4 |  Tanzania |
−55,197 | −24.6% | −1,811 | −1.04% |
| 5 |  Angola |
−53,131 | −17.7% | −1,969 | −0.78% |
| 6 |  Myanmar |
−45,689 | −30.2% | −1,119 | −1.03% |
| 7 |  Paraguay |
−43,315 | −43.7% | −632 | −1.10% |
| 8 |  Peru |
−36,984 | −12.4% | −1,156 | −0.44% |
| 9 |  Argentina |
−35,568 | −16.5% | −693 | −0.38% |
| 10 |  Mozambique |
−35,054 | −21.8% | −1,031 | −0.80% |
| 11 |  Bolivia |
−27,661 | −11.6% | −926 | −0.43% |
| 12 |  Colombia |
−21,284 | −8.5% | −515 | −0.22% |
| 13 |  Mexico |
−20,890 | −7.5% | −493 | −0.19% |
| 14 |  Burkina Faso |
−19,082 | −59.6% | −463 | −3.28% |
| 15 |  Ivory Coast |
−17,151 | −53.5% | −312 | −1.99% |
| 16 |  Cambodia |
−16,845 | −39.6% | −1,192 | −4.17% |
| 17 |  Nigeria |
−16,657 | −20.0% | −490 | −0.72% |
| 18 |  Nicaragua |
−15,411 | −56.2% | −2,296 (2023) | −14.03% (2023) |
| 19 |  Benin |
−14,708 | −54.6% | −144.3 | −1.15% |
| 20 |  Madagascar |
−14,019 | −26.5% | −480 | −1.20% |
| 21 |  Mali |
−13,199 | −24.4% | −388 | −0.93% |
| 22 |  Somalia |
−13,042 | −40.8% | −293.2 | −1.49% |
| 23 |  Venezuela |
−12,919 | −6.6% | −190.3 | −0.10% |
| 24 |  Cameroon |
−12,509 | −14.4% | −452 | −0.60% |
| 25 |  Chad |
−11,548 | −44.4% | −494 | −3.16% |
| 26 |  Zimbabwe |
−11,183 | −17.3% | −204.6 | −0.38% |
| 27 |  Zambia |
−9,423 | −5.1% | −375 | −0.21% |
| 28 |  Ecuador |
−8,848 | −15.7% | −116.4 | −0.24% |
| 29 |  Guinea |
−8,795 | −31.6% | −258.7 | −1.32% |
| 30 |  Uganda |
−8,310 | −47.3% | −108.5 | −1.14% |
| 31 |  Honduras |
−6,690 | −22.7% | −193.9 | −0.83% |
| 32 |  Malaysia |
−6,462 | −8.1% | −231.7 | −0.31% |
| 33 |  Liberia |
−6,338 | −20.5% | −156.7 | −0.63% |
| 34 |  Ethiopia |
−6,054 since 1993 | −5.5% since 1993 | −15.1 | −0.01% |
| 35 |  Malawi |
−5,514 | −40.8% | −162.2 | −1.93% |
| 36 |  Laos |
−5,127 | −9.2% | −136.4 | −0.27% |
| 37 |  Guatemala |
−5,033 | −26.9% | −50.9 | −0.37% |
| 38 |  CAR |
−4,994 | −2.8% | −179.6 | −0.10% |
| 39 |  Australia |
−4,120 | −0.8% | +208.9 | +0.04% |
| 40 |  Niger |
−3,417 | −45.5% | −19 | −0.46% |
| 41 |  Namibia |
−2,801 | −8.3% | −2.49 | −0.01% |
| 42 |  Sierra Leone |
−2,590 | −21.5% | −76.2 | −0.79% |
| 43 |  Papua New Guinea |
−2,246 | −1.7% | −14.5 | −0.01% |
| 44 |  Senegal |
−2,041 | −5.7% | −60 | −0.18% |
| 45 |  Thailand |
−1,736 | −2.2% | −533 | −0.69% |
| 46 |  Congo |
−1,603 | −1.9% | +54.1 | +0.06% |
| 47 |  Philippines |
−1,477 | −4.9% | +163.9 | +0.58% |
| 48 |  Panama |
−1,307 | −6.8% | −11.6 | −0.07% |
| 49 |  Pakistan |
−1,117 | −8.4% | +80.3 | +0.67% |
| 50 |  Equatorial Guinea |
−1,097 | −10.5% | −32.3 | −0.34% |
| 51 |  South Korea |
−1,035 | −4.1% | −14.6 | −0.06% |
| 52 |  Belize |
−993 | −16.3% | −29.1 | −0.56% |
| 53 |  Sri Lanka |
−943 | −10.3% | −19.1 | −0.23% |
| 54 |  Guyana |
−839 | −1.2% | −29.5 | −0.04% |
| 55 |  Gabon |
−819 | −0.9% | −26 | −0.03% |
| 56 |  Gambia |
−767 | −47.9% | −25.2 | −2.82% |
| 57 |  Eritrea |
−716 since 1993 | −11.3% since 1993 | −23.1 | −0.41% |
| 58 |  Suriname |
−671 | −1.2% | −70.5 | −0.12% |
| 59 |  Mongolia |
−671 | −1.2% | 0 | 0% |
| 60 |  Guinea-Bissau |
−593 | −6.8% | −16.4 | −0.20% |
| 61 |  Sweden |
−498 | −0.5% | 0 | 0% |
| 62 |  Bangladesh |
−428 | −5.6% | −3.81 | −0.05% |
| 63 |  Norway |
−408 | −0.9% | −9.4 | −0.02% |
| 64 |  Iraq |
−403 | −13.0% | −25.5 | −0.92% |
| 65 |  Portugal |
−314 | −2.4% | +21.8 | +0.17% |
| 66 |  Vanuatu |
−313 | −8.2% | −9.21 | −0.26% |
| 67 |  Togo |
−295.9 | −5.9% | +11.7 | +0.25% |
| 68 |  El Salvador |
−198.9 | −7.0% | +3.22 | +0.12% |
| 69 |  Eswatini |
−196.9 | −10.5% | −5.79 | −0.34% |
| 70 |  East Timor |
−175.3 | −4.1% | −3.27 | −0.08% |
| 71 |  Japan |
−153.7 | −0.2% | −8.49 | −0.01% |
| 72 |  Brunei |
−127.4 | −8.0% | 0 | 0% |
| 73 |  Bosnia |
−113.1 since 1992 | −1.3% since 1992 | +4.02 | +0.05% |
| 74 |  Solomon Islands |
−96.7 | −1.0% | −2.84 | −0.03% |
| 75 |  Algeria |
−88.5 | −1.3% | −2.61 | −0.04% |
| 76 |  Samoa |
−63.1 | −9.3% | −1.85 | −0.30% |
| 77 |  Trinidad |
−55.7 | −6.0% | −1.64 | −0.19% |
| 78 |  Comoros |
−53.6 | −29.5% | +0.39 | +0.30% |
| 79 |  Libya |
−43.8 | −5.2% | −1.29 | −0.16% |
| 80 |  Seychelles |
−28.5 | −21.7% | −0.84 | −0.80% |
| 81 |  Morocco |
−23 | −0.1% | +1.22 | +0.01% |
| 82 |  Sao Tome |
−14.7 | −6.5% | +0.1 | +0.05% |
| 83 |  Mauritius |
−10.7 | −6.8% | 0 | 0% |
| 84 |  Antigua |
−8.69 | −22.3% | −0.25 | −0.81% |
| 85 |  Dominica |
−5.56 | −2.4% | −0.17 | −0.08% |
| 86 |  Cayman Islands |
−1.58 | −3.1% | 0 | 0% |
| 87 |  Armenia |
−0.89 since 1992 | −0.1% since 1992 | +0.06 | 0% |
| 88 |  Afghanistan |
0 | 0% | 0 | 0% |
| 88 |  Bahamas |
0 | 0% | 0 | 0% |
| 88 |  Barbados |
0 | 0% | 0 | 0% |
| 88 |  Grenada |
0 | 0% | 0 | 0% |
| 88 |  Iran |
0 | 0% | 0 | 0% |
| 88 |  Jordan |
0 | 0% | 0 | 0% |
| 88 |  Kiribati |
0 | 0% | 0 | 0% |
| 88 |  Lesotho |
0 | 0% | 0 | 0% |
| 88 |  Maldives |
0 | 0% | 0 | 0% |
| 88 |  Oman |
0 | 0% | 0 | 0% |
| 88 |  Qatar |
0 | 0% | 0 | 0% |
| 88 |  Saint Kitts |
0 | 0% | 0 | 0% |
| 88 |  San Marino |
0 | 0% | 0 | 0% |
| 88 |  Tonga |
0 | 0% | 0 | 0% |
| 88 |  Turkmenistan |
0 since 1992 | 0% since 1992 | 0 | 0% |
| 88 |  Tuvalu |
0 | 0% | 0 | 0% |
| 88 |  Yemen |
0 | 0% | 0 | 0% |
| 105 |  Saint Vincent |
+0.15 | +0.1% | 0 | 0% |
| 106 |  Malta |
+0.46 | +34.3% | +0.01 | +0.54% |
| 107 |  Egypt |
+0.73 | +4.9% | +0.02 | +0.12% |
| 108 |  Marshall Islands |
+1.2 since 1991 | +3.3% since 1991 | 0 | 0% |
| 109 |  Djibouti |
+1.24 | +5.7% | +0.04 | +0.17% |
| 110 |  Andorra |
+2.01 | +2.9% | +0.05 | +0.07% |
| 111 |  Liechtenstein |
+2.66 | +13.3% | +0.33 | +1.50% |
| 112 |  Singapore |
+3.75 | +6.5% | 0 | 0% |
| 113 |  Haiti |
+5.79 | +0.4% | +5.41 | +0.38% |
| 114 |  Palestine |
+7.8 | +22.2% | 0 | 0% |
| 115 |  Botswana |
+8.88 | 0% | 0 | 0% |
| 116 |  Bahrain |
+9.73 | +183.9% | +1.85 | +18.54% |
| 117 |  Kuwait |
+11 | +82.6% | 0 | 0% |
| 118 |  Burundi |
+12.2 | +1.1% | 0 | 0% |
| 119 |  Lebanon |
+12.7 | +2.4% | +0.37 | +0.07% |
| 120 |  Palau |
+13.5 since 1991 | +9.1% since 1991 | +0.35 | +0.22% |
| 121 |  Saint Lucia |
+22.1 | +21.2% | +0.19 | +0.15% |
| 122 |  Saudi Arabia |
+23.2 | +0.2% | +5.79 | +0.05% |
| 123 |  UAE |
+36.6 | +3.0% | +1.29 | +0.10% |
| 124 |  Cyprus |
+41.5 | +6.7% | −0.65 | −0.10% |
| 125 |  Tajikistan |
+61 since 1992 | +3.9% since 1992 | +1.16 | +0.07% |
| 126 |  Israel |
+61.8 | +12.1% | +7.72 | +1.40% |
| 127 |  Cape Verde |
+65.4 | +50.6% | +2.39 | +1.27% |
| 128 |  Netherlands |
+90.9 | +6.8% | +1.74 | +0.12% |
| 129 |  Slovakia |
+140.9 since 1993 | +1.9% since 1993 | +7.16 | +0.10% |
| 130 |  Moldova |
+160.9 since 1992 | +12.7% since 1992 | −2.24 | −0.16% |
| 131 |  Iceland |
+164.4 | +237.5% | +3.73 | +1.66% |
| 132 |  Tunisia |
+176.9 | +7.1% | −8.89 | −0.33% |
| 133 |  Slovenia |
+180 since 1992 | +3.9% since 1992 | −0.21 | 0% |
| 134 |  Georgia |
+264.2 since 1992 | +2.3% since 1992 | 0 | 0% |
| 135 |  Syria |
+296.5 | +17.0% | +0.13 | +0.01% |
| 136 |  Croatia |
+339 since 1992 | +4.7% since 1992 | +5.1 | +0.07% |
| 137 |  Mauritania |
+345 | +9.6% | +10.2 | +0.26% |
| 138 |  Jamaica |
+352 | +17.5% | +15 | +0.64% |
| 139 |  North Macedonia |
+418 since 1992 | +11.7% since 1992 | −12.5 | −0.31% |
| 140 |  Kenya |
+420 | +2.9% | +248.9 | +1.75% |
| 141 |  Denmark |
+421 | +20.5% | +7.61 | +0.31% |
| 142 |  Kyrgyzstan |
+425 since 1992 | +9.6% since 1992 | +0.25 | +0.01% |
| 143 |  Switzerland |
+431 | +9.7% | +7.08 | +0.15% |
| 144 |  Czech Republic |
+433 since 1993 | +3.9% since 1993 | +34.9 | +0.31% |
| 145 |  Dominican Republic |
+458 | +5.6% | +25.6 | +0.30% |
| 146 |  Austria |
+484 | +3.3% | +10.9 | +0.07% |
| 147 |  Albania |
+588 | +19.3% | 0 | 0% |
| 148 |  Bhutan |
+681 | +7.0% | −32.8 | −0.31% |
| 149 |  Germany |
+682 | +1.6% | +18.5 | +0.04% |
| 150 |  Rwanda |
+707 | +41.9% | +56.2 | +2.50% |
| 151 |  Fiji |
+742 | +20.5% | +17.9 | +0.41% |
| 152 |  Costa Rica |
+878 | +8.2% | +13.6 | +0.12% |
| 153 |  Estonia |
+902 since 1992 | +10.6% since 1992 | +2.22 | +0.02% |
| 154 |  Azerbaijan |
+965 since 1992 | +26.2% since 1992 | +40.5 | +0.89% |
| 155 |  Lithuania |
+979 since 1992 | +12.9% since 1992 | +10.9 | +0.13% |
| 156 |  North Korea |
+1,008 | +3.5% | +43.8 | +0.15% |
| 157 |  Hungary |
+1,032 | +14.7% | +23.5 | +0.29% |
| 158 |  Latvia |
+1,057 since 1992 | +8.6% since 1992 | +25.3 | +0.19% |
| 159 |  Kazakhstan |
+1,334 since 1992 | +10.9% since 1992 | +53.7 | +0.40% |
| 160 |  Ireland |
+1,403 | +78.7% | +30.5 | +0.98% |
| 161 |  United Kingdom |
+1,882 | +17.5% | +48.6 | +0.39% |
| 162 |  Nepal |
+1,937 | +8.7% | +64 | +0.27% |
| 163 |  Romania |
+2,241 | +9.1% | +21.7 | +0.08% |
| 164 |  Poland |
+2,343 | +6.8% | +23.8 | +0.07% |
| 165 |  Bulgaria |
+2,392 | +18.6% | +48.6 | +0.32% |
| 166 |  Finland |
+2,578 | +3.1% | 0 | 0% |
| 167 |  Ukraine |
+2,822 since 1992 | +7.8% since 1992 | +146.7 | +0.38% |
| 168 |  New Zealand |
+3,333 | +9.2% | +260.8 | +0.67% |
| 169 |  Greece |
+4,069 | +28.4% | 0 | 0% |
| 170 |  Belarus |
+4,133 since 1992 | +13.6% since 1992 | +102.2 | +0.30% |
| 171 |  Uruguay |
+4,348 | +128.1% | +71 | +0.94% |
| 172 |  Ghana |
+4,689 | +20.9% | +137.9 | +0.52% |
| 173 |  Uzbekistan |
+4,716 since 1992 | +46.4% since 1992 | +158.4 | +1.09% |
| 174 |  Cuba |
+5,051 | +56.6% | +8.46 | +0.06% |
| 175 |  Chile |
+5,235 | +8.1% | −18.9 | −0.03% |
| 176 |  Italy |
+7,026 | +24.0% | +48.2 | +0.13% |
| 177 |  Turkey |
+11,217 | +14.7% | +452 | +0.52% |
| 178 |  South Africa |
+11,495 | +15.0% | +338 | +0.39% |
| 179 |  France |
+12,624 | +22.6% | +345 | +0.51% |
| 180 |  Spain |
+20,070 | +37.4% | +116.4 | +0.16% |
| 181 |  Vietnam |
+20,817 | +57.5% | +87.2 | +0.15% |
| 182 |  United States |
+25,162 | +2.2% | −278 | −0.02% |
| 183 |  Canada |
+31,087 | +2.2% | −37.9 | 0% |
| 184 |  India |
+33,649 | +13.6% | +332 | +0.12% |
| 185 |  Russia |
+77,175 since 1992 | +2.5% since 1992 | +3,242 | +0.10% |
| 186 |  China |
+264,099 | +43.5% | +6,220 | +0.73% |
| Not ranked: no forest data before 1994 | |||||
 Sudan |
−8,068 since 2012 | −8.6% since 2012 | −672 | −0.77% | |
 Curacao |
0 since 2011 | 0% since 2011 | 0 | 0% | |
 Luxembourg |
+7.72 since 2000 | +2.3% since 2000 | 0 | 0% | |
 Belgium |
+12.4 since 2000 | +0.5% since 2000 | 0 | 0% | |
 South Sudan |
+54 since 2012 | +0.2% since 2012 | +5.79 | +0.02% | |
 Montenegro |
+310 since 2006 | +10.8% since 2006 | 0 | 0% | |
 Taiwan |
+368 since 2011 | +4.5% since 2011 | +92.1 (2015) | +1.12% (2015) | |
 Serbia |
+2,758 since 2006 | +26.2% since 2006 | +153.2 | +1.19% | |
Brazil has lost the most forest since 1990, 498,460 mi² (1,291,006 km²) or 20.9% of its forest, and China has gained the most, 264,099 mi² (684,014 km²) or 43.5%. The list ranks 186 countries by their net forest change.
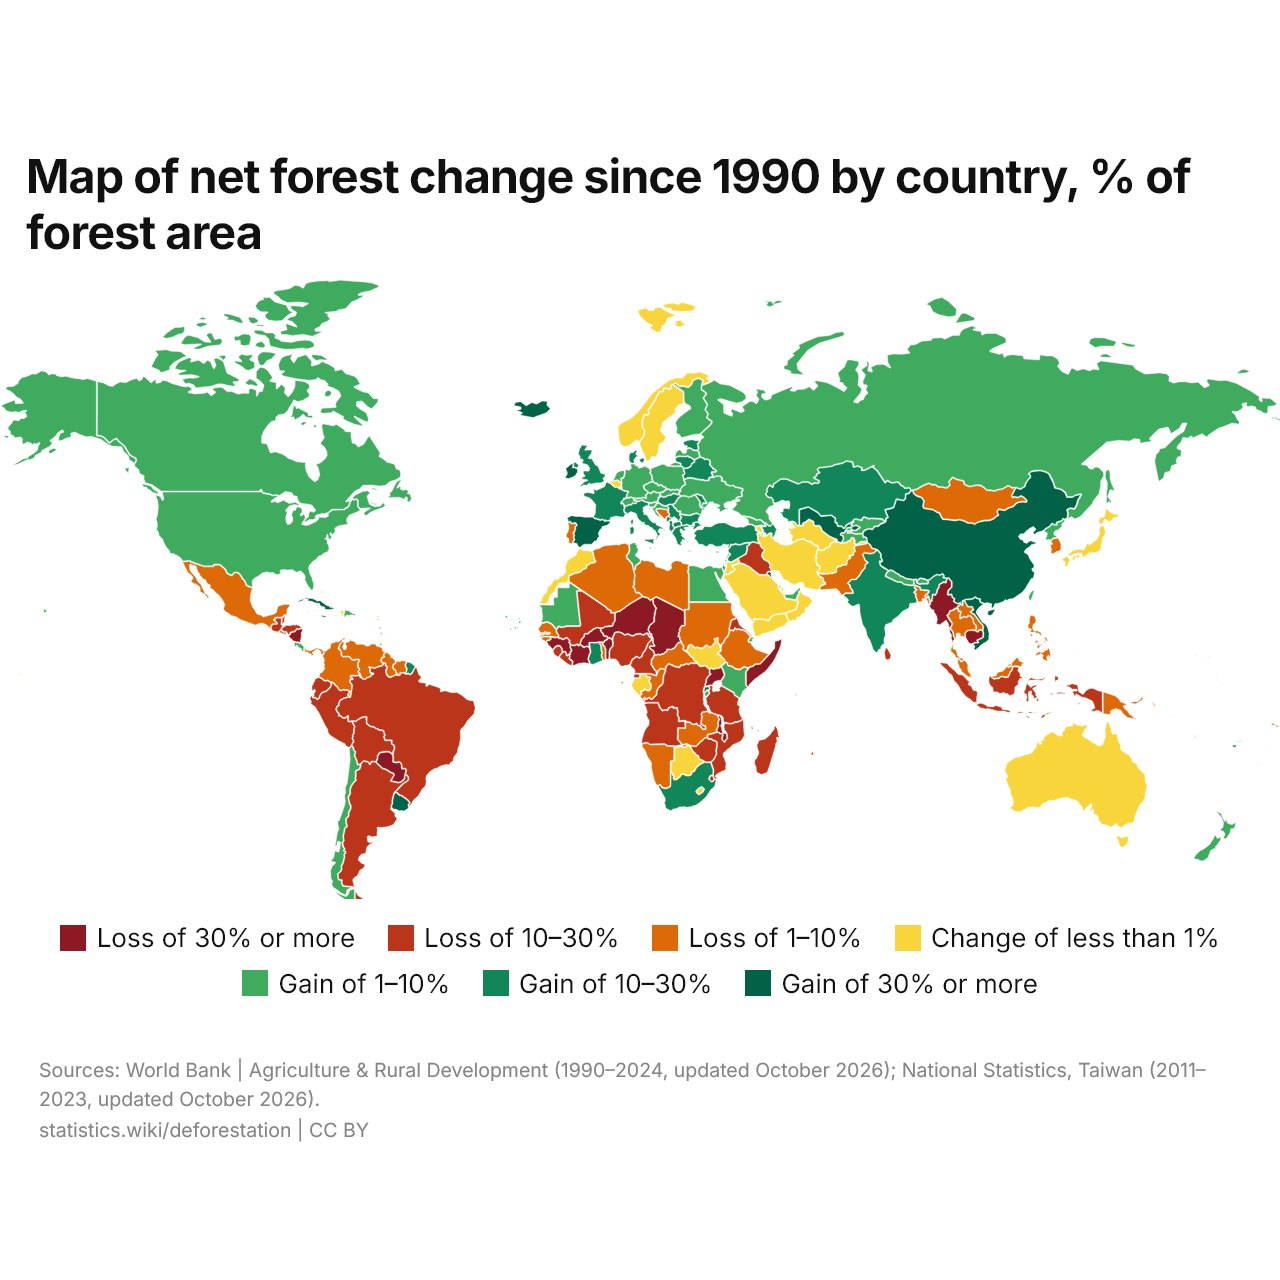
Map of net forest change since 1990 by country, % of forest area
- Loss of 30% or more
- Loss of 10–30%
- Loss of 1–10%
- Change of less than 1%
- Gain of 1–10%
- Gain of 10–30%
- Gain of 30% or more
Since 1990, 14 countries have lost 30% or more of their forest area and 13 have gained 30% or more; in 32, it has changed by less than 1%.
10 countries with the largest net forest loss since 1990, % of forest area
10 countries with the largest net forest gain since 1990, % of forest area
Burkina Faso has lost the largest share of its forest since 1990, 59.6%, followed by Nicaragua, 56.2%, and Benin, 54.6%. Iceland's forest area has grown the most in proportion, by 237.5%, or 164.4 mi² (426 km²).
10 countries with the largest net forest loss per year
10 countries with the largest net forest gain per year
Brazil loses the most forest, 12,572 mi² (32,560 km²) a year, followed by Nicaragua, 2,296 mi² (5,946 km²), and Angola, 1,969 mi² (5,100 km²). China gains the most, 6,220 mi² (16,110 km²) a year. The forest area is shrinking in 78 countries and growing in 70.
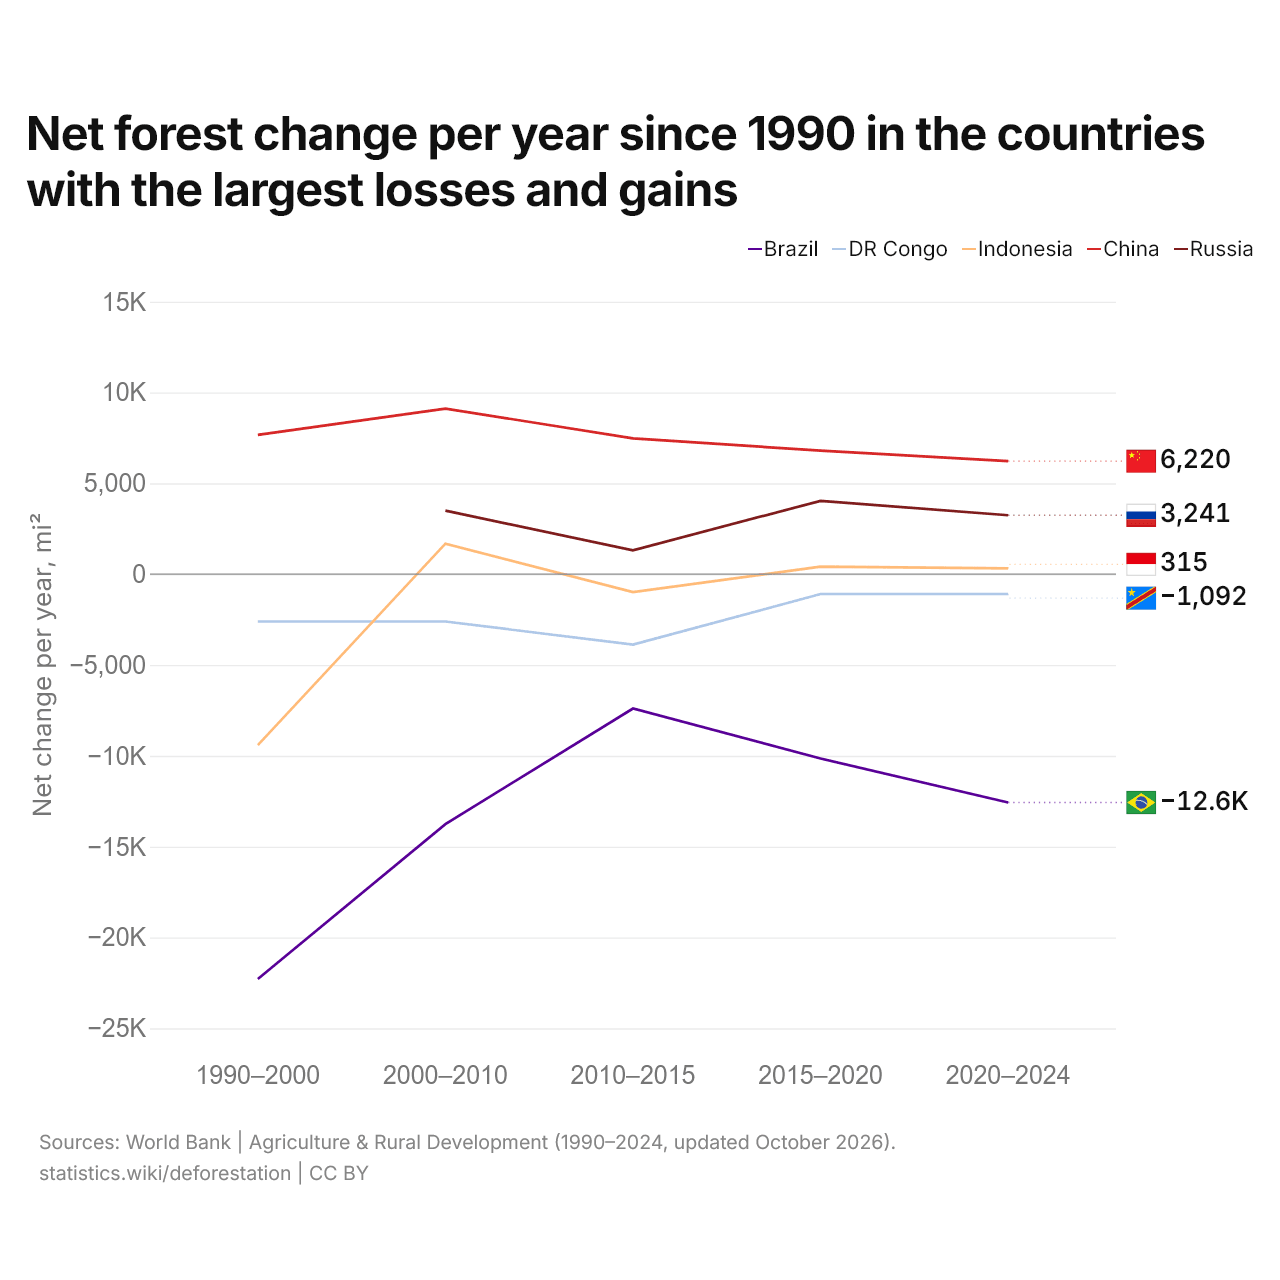
Net forest change per year since 1990 in the countries with the largest losses and gains
| Period | Net change per year, mi² | ||||
|---|---|---|---|---|---|
| Brazil | DR Congo | Indonesia | China | Russia | |
| 1990–2000 | −22,287 | −2,606 | −9,412 | 7,668 | - |
| 2000–2010 | −13,758 | −2,606 | 1,678 | 9,116 | 3,497 |
| 2010–2015 | −7,397 | −3,878 | −986 | 7,478 | 1,316 |
| 2015–2020 | −10,148 | −1,092 | 412 | 6,798 | 4,036 |
| 2020–2024 | −12,571 | −1,092 | 315 | 6,220 | 3,241 |
Brazil loses 12,572 mi² (32,560 km²) of forest a year, down from 22,287 mi² (57,723 km²) in 1990–2000. China gains 6,220 mi² (16,110 km²) of forest a year, down from 7,668 mi² (19,860 km²) in 1990–2000.
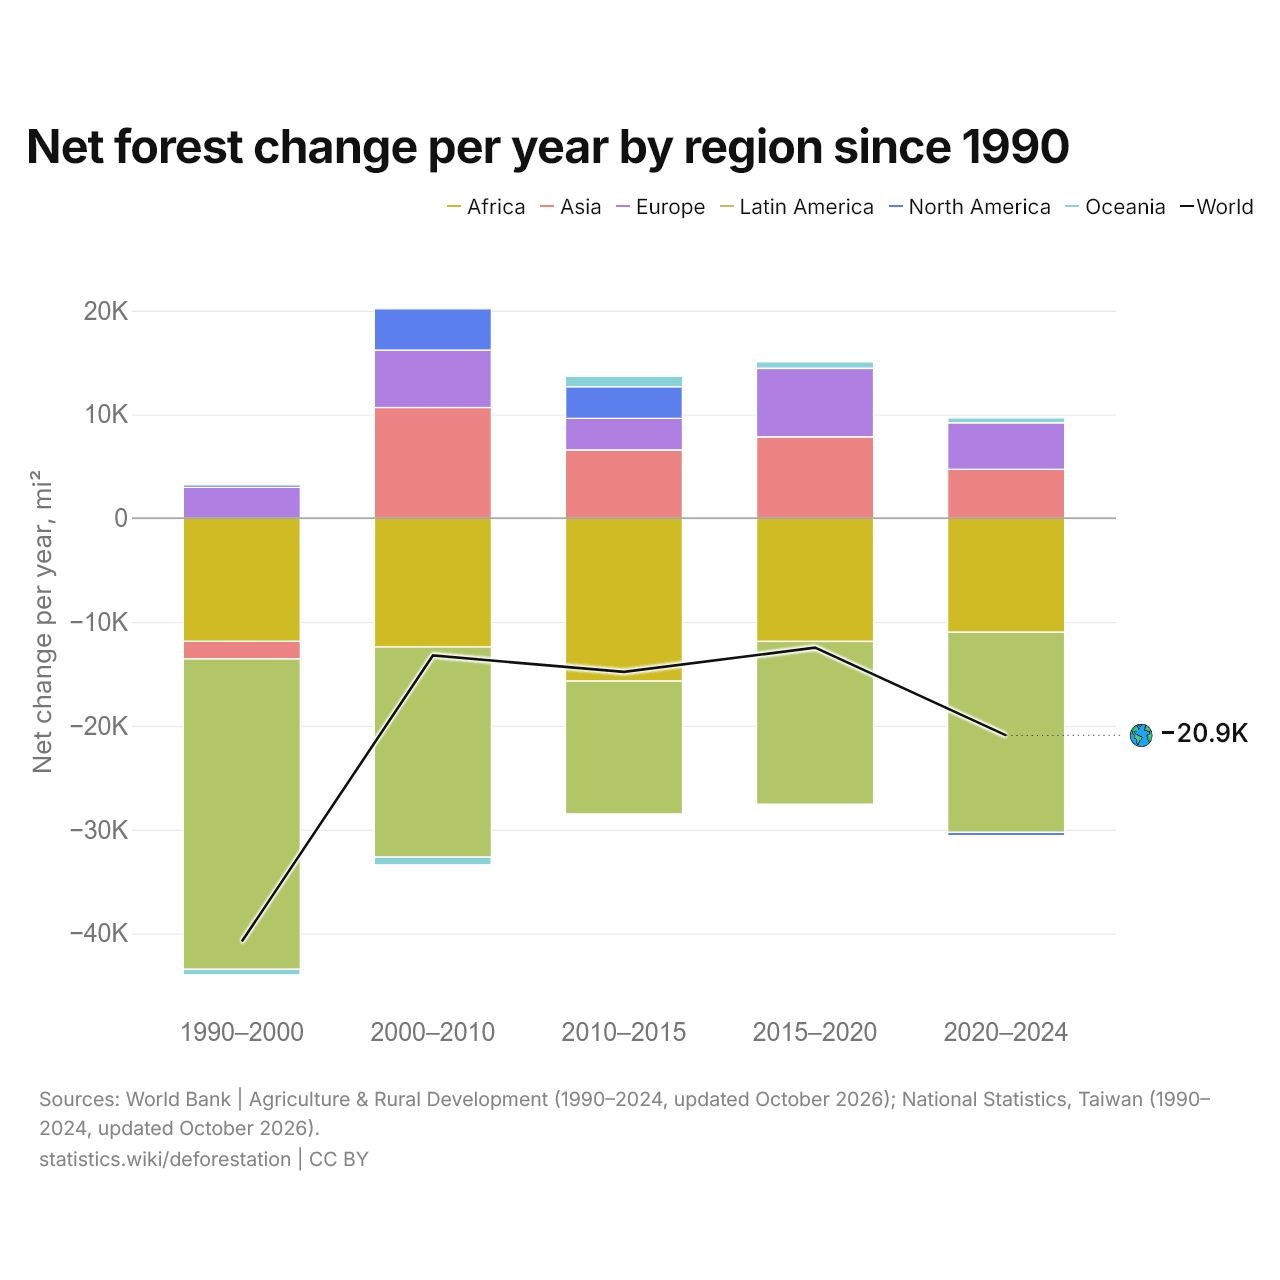
Net forest change per year by region since 1990
| Period | Net change per year, mi² | ||||||
|---|---|---|---|---|---|---|---|
| Africa | Asia | Europe | Latin America | North America | Oceania | World | |
| 1990–2000 | −11,870 | −1,690 | 2,971 | −29,897 | 237 | −531 | −40,780 |
| 2000–2010 | −12,409 | 10,665 | 5,526 | −20,236 | 3,981 | −746 | −13,221 |
| 2010–2015 | −15,693 | 6,583 | 3,034 | −12,793 | 3,041 | 1,017 | −14,811 |
| 2015–2020 | −11,870 | 7,834 | 6,596 | −15,676 | 26.1 | 620 | −12,470 |
| 2020–2024 | −10,985 | 4,710 | 4,487 | −19,279 | −316 | 459 | −20,924 |
| Per year, mi² | 1990–2000 | 2000–2010 | 2010–2015 | 2015–2020 | 2020–2024 |
|---|---|---|---|---|---|
 World |
−40,780 | −13,221 | −14,811 | −12,470 | −20,924 |
 Africa |
−11,870 | −12,409 | −15,693 | −11,870 | −10,985 |
 Asia |
−1,690 | +10,664 | +6,583 | +7,834 | +4,710 |
 Europe |
+2,971 | +5,525 | +3,034 | +6,596 | +4,487 |
 Latin America |
−29,897 | −20,237 | −12,793 | −15,676 | −19,279 |
 North America |
+237 | +3,981 | +3,041 | +26.1 | −316 |
 Oceania |
−531 | −746 | +1,017 | +620 | +460 |
Of the regions, Latin America loses the most forest, 19,279 mi² (49,932 km²) a year, and Asia gains the most, 4,710 mi² (12,199 km²) a year.
Compare the deforestation of any 2 countries
Sources:
- World Bank | Agriculture & Rural Development (1990–2024, updated October 2026)
- National Statistics, Taiwan (2011–2023, updated October 2026)
Creative Commons Attribution (CC BY): you may copy, share, adapt and reuse this content, also commercially, as long as you credit statistics.wiki and note any changes you made. The sources listed above may have their own license terms.