
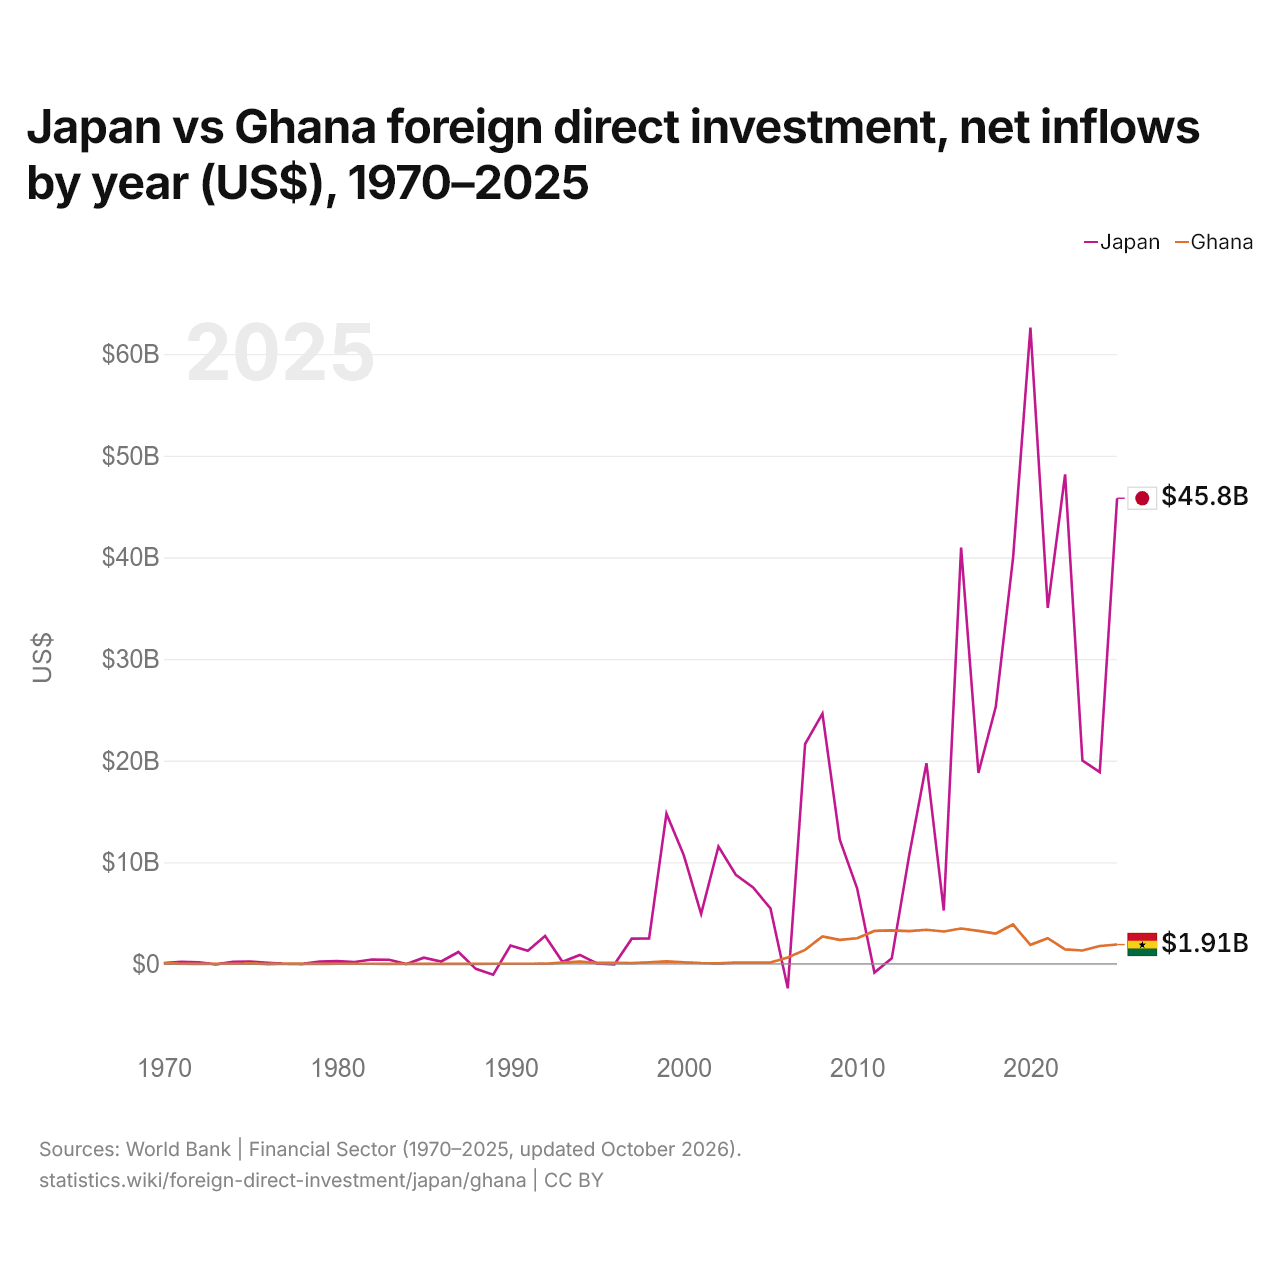
Japon vs Ghana : investissements directs étrangers, entrées nettes par année ($ US), 1970–2025
| Année | $ US | |
|---|---|---|
 Japon |
 Ghana |
|
| 2025 | 45 805 721 095 $ US | 1 908 244 011 $ US |
| 2024 | 18 874 093 729 $ US | 1 765 552 580 $ US |
| 2023 | 20 007 989 123 $ US | 1 319 315 615 $ US |
| 2022 | 48 153 832 744 $ US | 1 428 411 737 $ US |
| 2021 | 35 027 163 876 $ US | 2 533 586 462 $ US |
| 2020 | 62 584 719 398 $ US | 1 875 782 953 $ US |
| 2019 | 39 960 544 340 $ US | 3 879 831 470 $ US |
| 2018 | 25 289 367 858 $ US | 2 989 035 000 $ US |
| 2017 | 18 802 251 208 $ US | 3 254 990 000 $ US |
| 2016 | 40 954 181 469 $ US | 3 485 333 369 $ US |
| 2015 | 5 252 218 412 $ US | 3 192 320 531 $ US |
| 2014 | 19 752 249 424 $ US | 3 363 389 444 $ US |
| 2013 | 10 648 441 636 $ US | 3 227 000 000 $ US |
| 2012 | 546 962 692 $ US | 3 294 520 000 $ US |
| 2011 | −850 717 035 $ US | 3 247 588 000 $ US |
| 2010 | 7 440 979 284 $ US | 2 527 350 000 $ US |
| 2009 | 12 226 471 579 $ US | 2 372 540 000 $ US |
| 2008 | 24 624 845 330 $ US | 2 714 916 344 $ US |
| 2007 | 21 631 204 436 $ US | 1 383 177 930 $ US |
| 2006 | −2 396 909 736 $ US | 636 010 000 $ US |
| 2005 | 5 459 618 343 $ US | 144 970 000 $ US |
| 2004 | 7 527 948 175 $ US | 139 270 000 $ US |
| 2003 | 8 771 535 612 $ US | 136 751 000 $ US |
| 2002 | 11 557 373 874 $ US | 58 930 000 $ US |
| 2001 | 4 926 033 619 $ US | 89 320 000 $ US |
| 2000 | 10 688 168 326 $ US | 165 900 000 $ US |
| 1999 | 14 780 510 031 $ US | 243 700 000 $ US |
| 1998 | 2 512 021 924 $ US | 167 400 000 $ US |
| 1997 | 2 486 935 040 $ US | 81 800 000 $ US |
| 1996 | −38 203 596 $ US | 120 000 000 $ US |
| 1995 | 41 463 072 $ US | 106 500 000 $ US |
| 1994 | 888 384 471 $ US | 233 000 000 $ US |
| 1993 | 210 435 439 $ US | 125 000 000 $ US |
| 1992 | 2 755 603 983 $ US | 22 500 000 $ US |
| 1991 | 1 284 268 820 $ US | 20 000 000 $ US |
| 1990 | 1 806 039 008 $ US | 14 800 000 $ US |
| 1989 | −1 059 696 732 $ US | 15 000 000 $ US |
| 1988 | −483 800 487 $ US | 5 000 000 $ US |
| 1987 | 1 177 422 254 $ US | 4 700 000 $ US |
| 1986 | 242 107 762 $ US | 4 300 000 $ US |
| 1985 | 608 713 150 $ US | 5 600 000 $ US |
| 1984 | −10 000 000 $ US | 2 000 000 $ US |
| 1983 | 416 000 000 $ US | 2 400 000 $ US |
| 1982 | 439 000 000 $ US | 16 300 000 $ US |
| 1981 | 189 000 000 $ US | 16 263 752 $ US |
| 1980 | 278 000 000 $ US | 15 600 000 $ US |
| 1979 | 239 000 000 $ US | −2 800 000 $ US |
| 1978 | 8 000 000 $ US | 9 696 237 $ US |
| 1977 | 21 000 000 $ US | 19 217 479 $ US |
| 1976 | 113 000 000 $ US | −18 260 970 $ US |
| 1975 | 226 000 000 $ US | 70 869 955 $ US |
| 1974 | 202 000 000 $ US | 14 270 000 $ US |
| 1973 | −42 000 000 $ US | 14 400 000 $ US |
| 1972 | 169 000 000 $ US | 11 500 000 $ US |
| 1971 | 210 000 000 $ US | 30 600 000 $ US |
| 1970 | 94 000 000 $ US | 67 800 000 $ US |
En 2025, les entrées nettes d'investissements directs étrangers étaient de 45,8 milliards de dollars au Japon et de 1,91 milliard de dollars au Ghana : 24 fois plus au Japon. En 1970, elles étaient de 94 millions de dollars au Japon et de 67,8 millions de dollars au Ghana.
Les entrées nettes d'investissements directs étrangers au Japon ont été supérieures à celles du Ghana pendant 46 des 56 années de 1970 à 2025, et inférieures pendant 10.
Japon vs Ghana : dernières entrées et sorties d'investissements étrangers
|
Japon
|
Ghana
|
|
|---|---|---|
| Entrées nettes | +45,8 Md $US | +1,91 Md $US |
| Entrées nettes, % du PIB | +1,0 % | +1,7 % |
| Sorties nettes | +218 Md $US | +38,8 M $US |
| Entrées nettes, total 2016–2025 | +355 Md $US | +24,4 Md $US |
| Rang mondial | 10/192 | 68/192 |
Comparer les investissements directs étrangers de 2 pays au choix
Sources :
- Banque mondiale | Secteur financier (1970–2025, mis à jour en octobre 2026)
Creative Commons Attribution (CC BY) : vous pouvez copier, partager, adapter et réutiliser ce contenu, y compris à des fins commerciales, à condition de citer statistics.wiki et d’indiquer les modifications apportées. Les sources citées ci-dessus peuvent avoir leurs propres conditions de licence.