
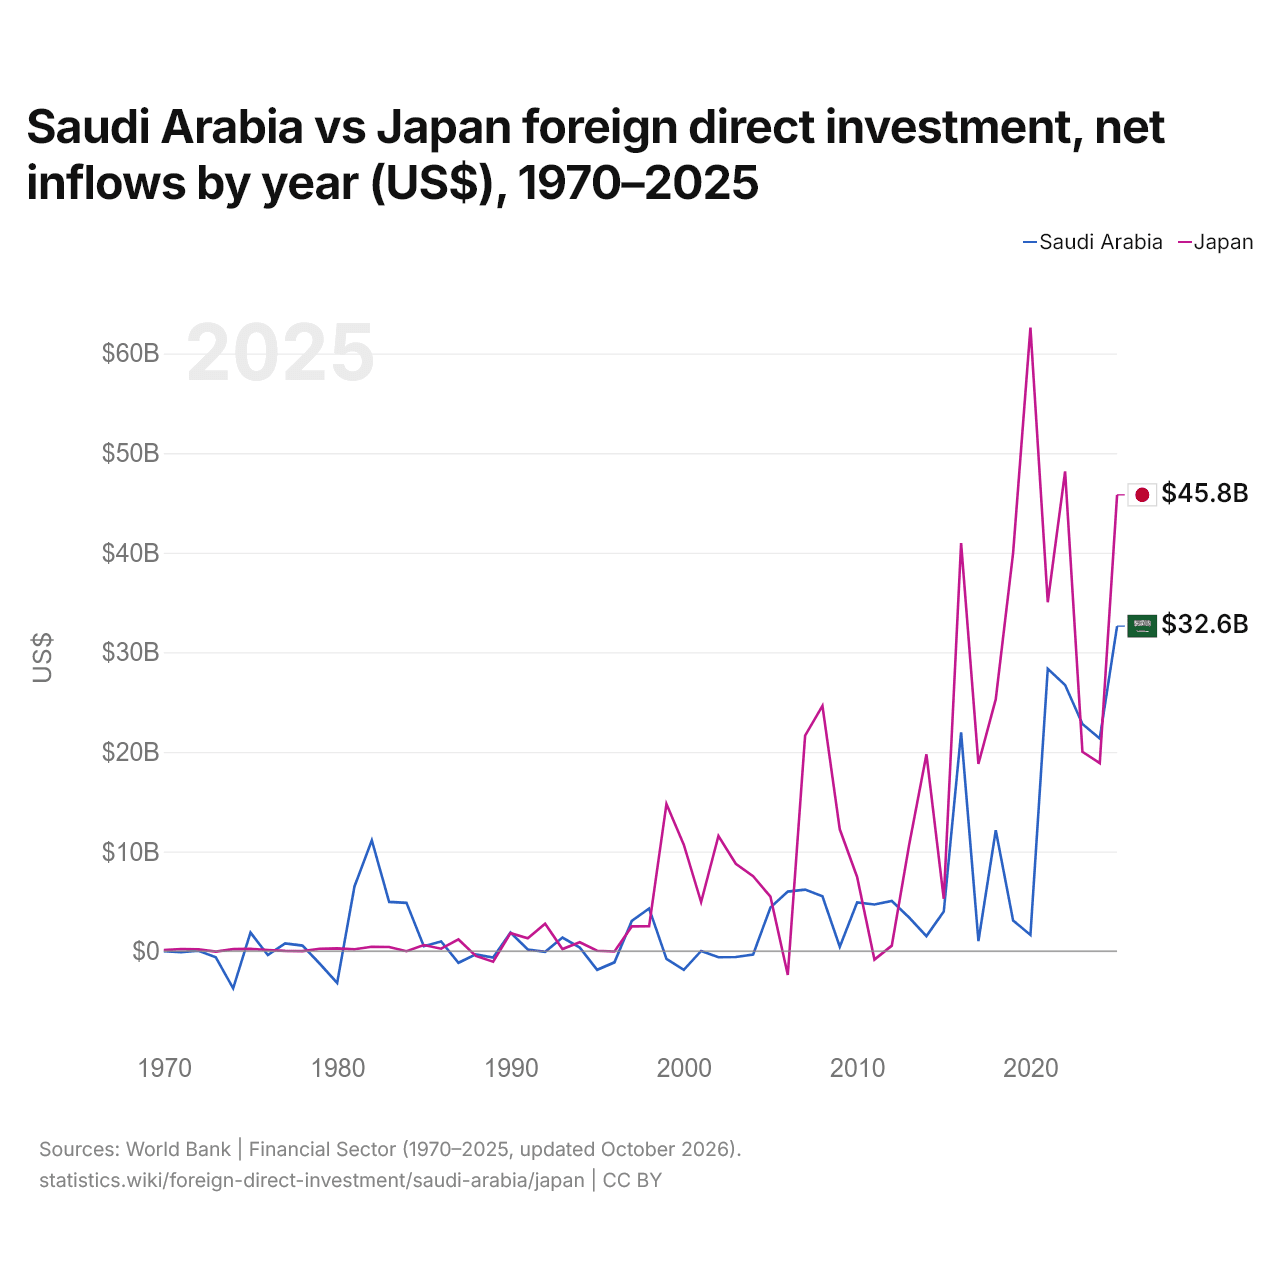
Arabie saoudite vs Japon : investissements directs étrangers, entrées nettes par année ($ US), 1970–2025
| Année | $ US | |
|---|---|---|
 Arabie saoudite |
 Japon |
|
| 2025 | 32 628 095 187 $ US | 45 805 721 095 $ US |
| 2024 | 21 337 562 070 $ US | 18 874 093 729 $ US |
| 2023 | 22 803 498 161 $ US | 20 007 989 123 $ US |
| 2022 | 26 710 062 133 $ US | 48 153 832 744 $ US |
| 2021 | 28 350 373 333 $ US | 35 027 163 876 $ US |
| 2020 | 1 621 264 195 $ US | 62 584 719 398 $ US |
| 2019 | 3 079 217 251 $ US | 39 960 544 340 $ US |
| 2018 | 12 141 122 233 $ US | 25 289 367 858 $ US |
| 2017 | 1 014 062 501 $ US | 18 802 251 208 $ US |
| 2016 | 21 954 833 890 $ US | 40 954 181 469 $ US |
| 2015 | 3 970 644 085 $ US | 5 252 218 412 $ US |
| 2014 | 1 509 063 087 $ US | 19 752 249 424 $ US |
| 2013 | 3 371 408 457 $ US | 10 648 441 636 $ US |
| 2012 | 5 035 060 851 $ US | 546 962 692 $ US |
| 2011 | 4 683 855 881 $ US | −850 717 035 $ US |
| 2010 | 4 878 894 395 $ US | 7 440 979 284 $ US |
| 2009 | 436 351 282 $ US | 12 226 471 579 $ US |
| 2008 | 5 505 983 969 $ US | 24 624 845 330 $ US |
| 2007 | 6 175 321 115 $ US | 21 631 204 436 $ US |
| 2006 | 5 975 887 389 $ US | −2 396 909 736 $ US |
| 2005 | 4 385 456 396 $ US | 5 459 618 343 $ US |
| 2004 | −334 320 000 $ US | 7 527 948 175 $ US |
| 2003 | −586 506 667 $ US | 8 771 535 612 $ US |
| 2002 | −614 133 333 $ US | 11 557 373 874 $ US |
| 2001 | 19 640 000 $ US | 4 926 033 619 $ US |
| 2000 | −1 881 066 667 $ US | 10 688 168 326 $ US |
| 1999 | −778 933 333 $ US | 14 780 510 031 $ US |
| 1998 | 4 283 466 667 $ US | 2 512 021 924 $ US |
| 1997 | 3 039 466 667 $ US | 2 486 935 040 $ US |
| 1996 | −1 127 466 667 $ US | −38 203 596 $ US |
| 1995 | −1 874 666 667 $ US | 41 463 072 $ US |
| 1994 | 349 333 333 $ US | 888 384 471 $ US |
| 1993 | 1 367 200 000 $ US | 210 435 439 $ US |
| 1992 | −78 933 333 $ US | 2 755 603 983 $ US |
| 1991 | 160 000 000 $ US | 1 284 268 820 $ US |
| 1990 | 1 861 333 333 $ US | 1 806 039 008 $ US |
| 1989 | −653 333 333 $ US | −1 059 696 732 $ US |
| 1988 | −328 000 000 $ US | −483 800 487 $ US |
| 1987 | −1 173 333 333 $ US | 1 177 422 254 $ US |
| 1986 | 965 935 919 $ US | 242 107 762 $ US |
| 1985 | 491 422 763 $ US | 608 713 150 $ US |
| 1984 | 4 849 863 063 $ US | −10 000 000 $ US |
| 1983 | 4 943 904 678 $ US | 416 000 000 $ US |
| 1982 | 11 128 383 580 $ US | 439 000 000 $ US |
| 1981 | 6 498 136 246 $ US | 189 000 000 $ US |
| 1980 | −3 192 312 800 $ US | 278 000 000 $ US |
| 1979 | −1 270 516 965 $ US | 239 000 000 $ US |
| 1978 | 555 954 028 $ US | 8 000 000 $ US |
| 1977 | 782 964 286 $ US | 21 000 000 $ US |
| 1976 | −396 600 567 $ US | 113 000 000 $ US |
| 1975 | 1 864 901 265 $ US | 226 000 000 $ US |
| 1974 | −3 732 394 367 $ US | 202 000 000 $ US |
| 1973 | −625 912 389 $ US | −42 000 000 $ US |
| 1972 | 33 777 644 $ US | 169 000 000 $ US |
| 1971 | −111 437 265 $ US | 210 000 000 $ US |
| 1970 | 7 360 000 $ US | 94 000 000 $ US |
En 2025, les entrées nettes d'investissements directs étrangers étaient de 32,6 milliards de dollars en Arabie saoudite et de 45,8 milliards de dollars au Japon : 40 % de plus au Japon. En 1970, elles étaient de 7,36 millions de dollars en Arabie saoudite et de 94 millions de dollars au Japon.
Les entrées nettes d'investissements directs étrangers en Arabie saoudite ont été supérieures à celles du Japon pendant 19 des 56 années de 1970 à 2025, et inférieures pendant 37. Les entrées nettes en Arabie saoudite et au Japon ont été négatives (désinvestissement) en même temps pendant 4 de ces années, la dernière fois en 1996.
Arabie saoudite vs Japon : dernières entrées et sorties d'investissements étrangers
|
Arabie saoudite
|
Japon
|
|
|---|---|---|
| Entrées nettes | +32,6 Md $US | +45,8 Md $US |
| Entrées nettes, % du PIB | +2,6 % | +1,0 % |
| Sorties nettes | +27,0 Md $US | +218 Md $US |
| Entrées nettes, total 2016–2025 | +172 Md $US | +355 Md $US |
| Rang mondial | 16/192 | 10/192 |
Comparer les investissements directs étrangers de 2 pays au choix
Sources :
- Banque mondiale | Secteur financier (1970–2025, mis à jour en octobre 2026)
Creative Commons Attribution (CC BY) : vous pouvez copier, partager, adapter et réutiliser ce contenu, y compris à des fins commerciales, à condition de citer statistics.wiki et d’indiquer les modifications apportées. Les sources citées ci-dessus peuvent avoir leurs propres conditions de licence.