
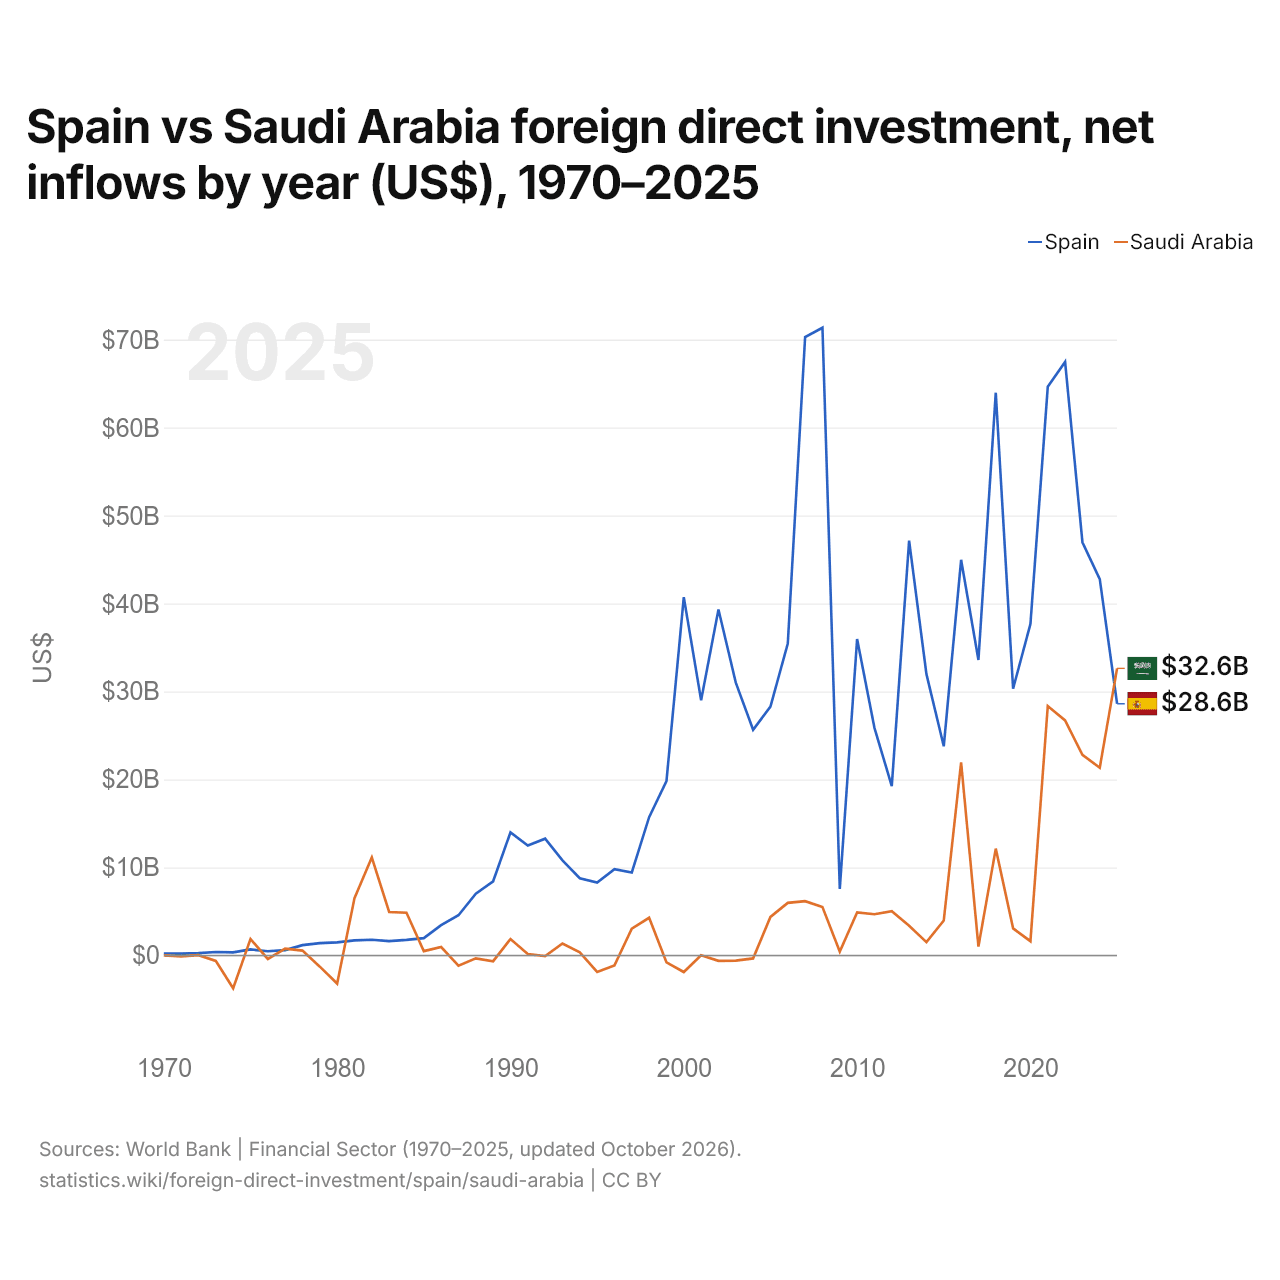
Espagne vs Arabie saoudite : investissements directs étrangers, entrées nettes par année ($ US), 1970–2025
| Année | $ US | |
|---|---|---|
 Espagne |
 Arabie saoudite |
|
| 2025 | 28 605 385 349 $ US | 32 628 095 187 $ US |
| 2024 | 42 778 827 261 $ US | 21 337 562 070 $ US |
| 2023 | 46 961 991 977 $ US | 22 803 498 161 $ US |
| 2022 | 67 459 796 904 $ US | 26 710 062 133 $ US |
| 2021 | 64 626 902 394 $ US | 28 350 373 333 $ US |
| 2020 | 37 683 095 972 $ US | 1 621 264 195 $ US |
| 2019 | 30 322 872 791 $ US | 3 079 217 251 $ US |
| 2018 | 63 958 429 157 $ US | 12 141 122 233 $ US |
| 2017 | 33 577 736 759 $ US | 1 014 062 501 $ US |
| 2016 | 44 962 670 966 $ US | 21 954 833 890 $ US |
| 2015 | 23 777 330 434 $ US | 3 970 644 085 $ US |
| 2014 | 31 972 292 815 $ US | 1 509 063 087 $ US |
| 2013 | 47 143 326 585 $ US | 3 371 408 457 $ US |
| 2012 | 19 250 404 232 $ US | 5 035 060 851 $ US |
| 2011 | 25 874 478 946 $ US | 4 683 855 881 $ US |
| 2010 | 35 969 020 813 $ US | 4 878 894 395 $ US |
| 2009 | 7 562 359 637 $ US | 436 351 282 $ US |
| 2008 | 71 347 116 196 $ US | 5 505 983 969 $ US |
| 2007 | 70 291 846 189 $ US | 6 175 321 115 $ US |
| 2006 | 35 455 663 078 $ US | 5 975 887 389 $ US |
| 2005 | 28 282 647 905 $ US | 4 385 456 396 $ US |
| 2004 | 25 642 926 665 $ US | −334 320 000 $ US |
| 2003 | 31 005 892 771 $ US | −586 506 667 $ US |
| 2002 | 39 314 607 366 $ US | −614 133 333 $ US |
| 2001 | 29 016 725 788 $ US | 19 640 000 $ US |
| 2000 | 40 723 543 114 $ US | −1 881 066 667 $ US |
| 1999 | 19 806 975 251 $ US | −778 933 333 $ US |
| 1998 | 15 714 658 309 $ US | 4 283 466 667 $ US |
| 1997 | 9 433 660 065 $ US | 3 039 466 667 $ US |
| 1996 | 9 801 379 213 $ US | −1 127 466 667 $ US |
| 1995 | 8 281 607 345 $ US | −1 874 666 667 $ US |
| 1994 | 8 772 628 137 $ US | 349 333 333 $ US |
| 1993 | 10 808 165 173 $ US | 1 367 200 000 $ US |
| 1992 | 13 275 723 087 $ US | −78 933 333 $ US |
| 1991 | 12 492 782 829 $ US | 160 000 000 $ US |
| 1990 | 13 983 611 812 $ US | 1 861 333 333 $ US |
| 1989 | 8 428 379 549 $ US | −653 333 333 $ US |
| 1988 | 7 020 568 174 $ US | −328 000 000 $ US |
| 1987 | 4 570 700 793 $ US | −1 173 333 333 $ US |
| 1986 | 3 450 598 177 $ US | 965 935 919 $ US |
| 1985 | 1 967 804 468 $ US | 491 422 763 $ US |
| 1984 | 1 771 829 760 $ US | 4 849 863 063 $ US |
| 1983 | 1 622 388 936 $ US | 4 943 904 678 $ US |
| 1982 | 1 782 685 066 $ US | 11 128 383 580 $ US |
| 1981 | 1 706 766 879 $ US | 6 498 136 246 $ US |
| 1980 | 1 492 697 190 $ US | −3 192 312 800 $ US |
| 1979 | 1 396 810 449 $ US | −1 270 516 965 $ US |
| 1978 | 1 178 156 262 $ US | 555 954 028 $ US |
| 1977 | 607 674 770 $ US | 782 964 286 $ US |
| 1976 | 477 622 020 $ US | −396 600 567 $ US |
| 1975 | 682 635 311 $ US | 1 864 901 265 $ US |
| 1974 | 358 000 000 $ US | −3 732 394 367 $ US |
| 1973 | 390 000 000 $ US | −625 912 389 $ US |
| 1972 | 268 000 000 $ US | 33 777 644 $ US |
| 1971 | 202 000 000 $ US | −111 437 265 $ US |
| 1970 | 222 000 000 $ US | 7 360 000 $ US |
En 2025, les entrées nettes d'investissements directs étrangers étaient de 28,6 milliards de dollars en Espagne et de 32,6 milliards de dollars en Arabie saoudite : 14 % de plus en Arabie saoudite. En 1970, elles étaient de 222 millions de dollars en Espagne et de 7,36 millions de dollars en Arabie saoudite.
Les entrées nettes d'investissements directs étrangers en Espagne ont été supérieures à celles de l'Arabie saoudite pendant 49 des 56 années de 1970 à 2025, et inférieures pendant 7.
Espagne vs Arabie saoudite : dernières entrées et sorties d'investissements étrangers
|
Espagne
|
Arabie saoudite
|
|
|---|---|---|
| Entrées nettes | +28,6 Md $US | +32,6 Md $US |
| Entrées nettes, % du PIB | +1,5 % | +2,6 % |
| Sorties nettes | +47,2 Md $US | +27,0 Md $US |
| Entrées nettes, total 2016–2025 | +461 Md $US | +172 Md $US |
| Rang mondial | 17/192 | 16/192 |
Comparer les investissements directs étrangers de 2 pays au choix
Sources :
- Banque mondiale | Secteur financier (1970–2025, mis à jour en octobre 2026)
Creative Commons Attribution (CC BY) : vous pouvez copier, partager, adapter et réutiliser ce contenu, y compris à des fins commerciales, à condition de citer statistics.wiki et d’indiquer les modifications apportées. Les sources citées ci-dessus peuvent avoir leurs propres conditions de licence.