
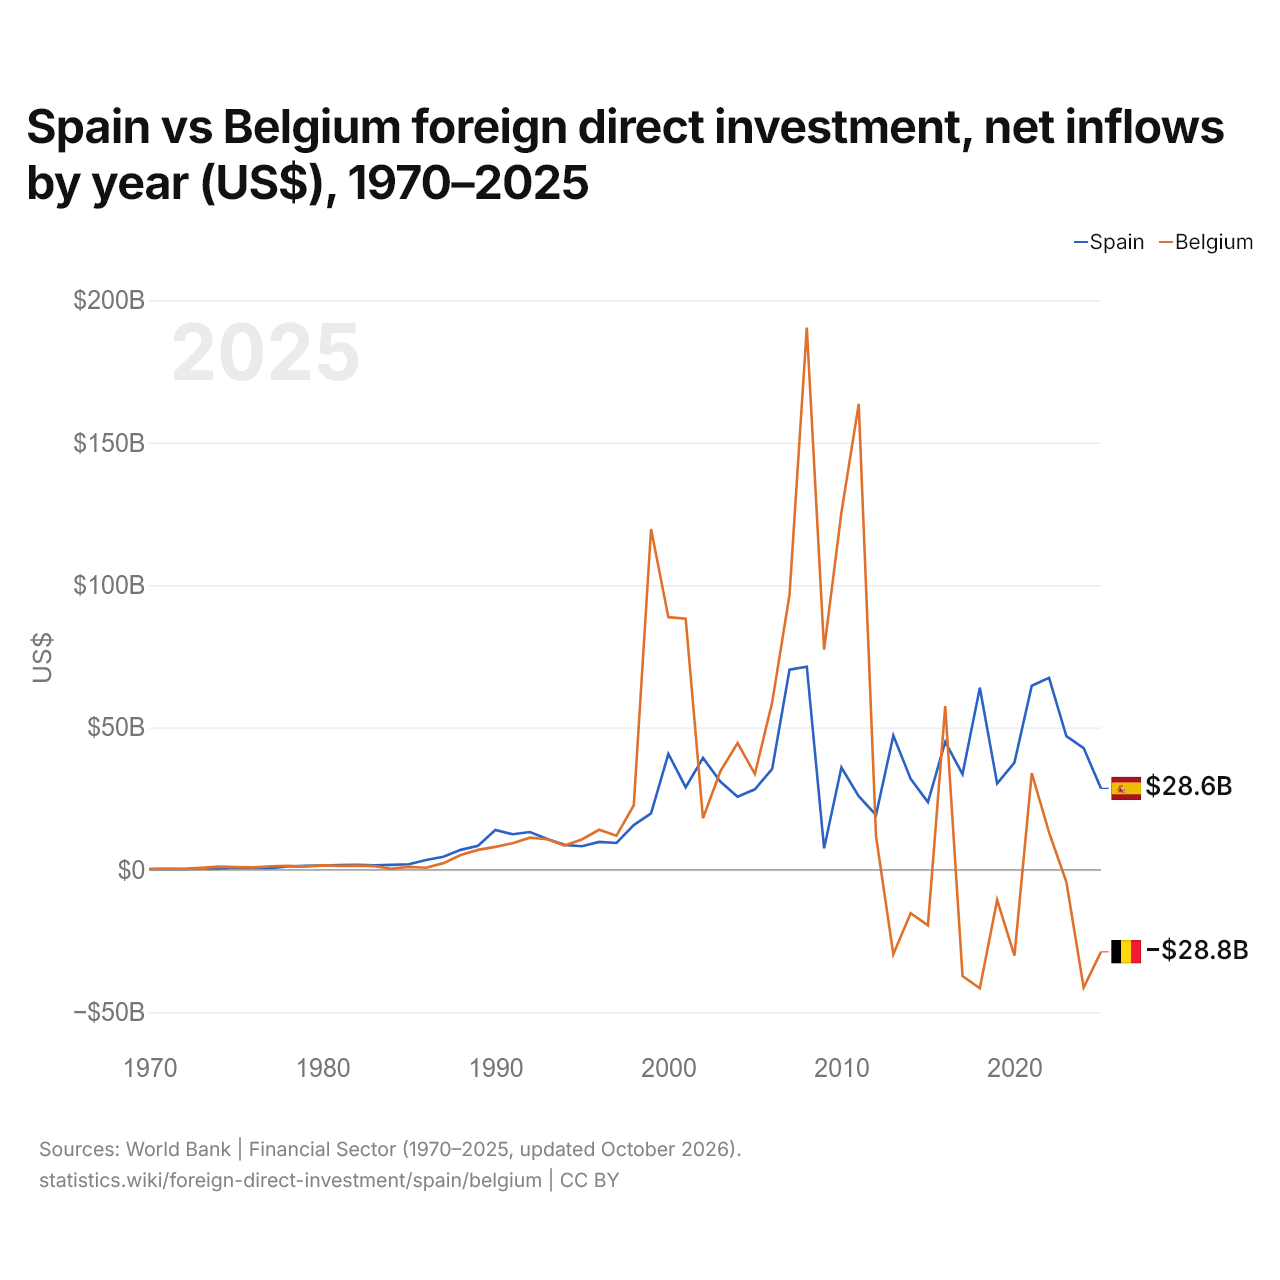
Espagne vs Belgique : investissements directs étrangers, entrées nettes par année ($ US), 1970–2025
| Année | $ US | |
|---|---|---|
 Espagne |
 Belgique |
|
| 2025 | 28 605 385 349 $ US | −28 789 111 917 $ US |
| 2024 | 42 778 827 261 $ US | −41 357 732 773 $ US |
| 2023 | 46 961 991 977 $ US | −4 247 857 015 $ US |
| 2022 | 67 459 796 904 $ US | 13 136 474 102 $ US |
| 2021 | 64 626 902 394 $ US | 33 980 656 226 $ US |
| 2020 | 37 683 095 972 $ US | −30 140 703 657 $ US |
| 2019 | 30 322 872 791 $ US | −10 587 088 044 $ US |
| 2018 | 63 958 429 157 $ US | −41 601 387 267 $ US |
| 2017 | 33 577 736 759 $ US | −37 288 840 312 $ US |
| 2016 | 44 962 670 966 $ US | 57 538 351 507 $ US |
| 2015 | 23 777 330 434 $ US | −19 514 245 855 $ US |
| 2014 | 31 972 292 815 $ US | −15 205 871 358 $ US |
| 2013 | 47 143 326 585 $ US | −29 640 924 980 $ US |
| 2012 | 19 250 404 232 $ US | 11 810 272 331 $ US |
| 2011 | 25 874 478 946 $ US | 163 624 381 385 $ US |
| 2010 | 35 969 020 813 $ US | 125 491 894 873 $ US |
| 2009 | 7 562 359 637 $ US | 77 354 509 260 $ US |
| 2008 | 71 347 116 196 $ US | 190 391 844 689 $ US |
| 2007 | 70 291 846 189 $ US | 96 551 634 531 $ US |
| 2006 | 35 455 663 078 $ US | 58 821 552 824 $ US |
| 2005 | 28 282 647 905 $ US | 33 662 010 794 $ US |
| 2004 | 25 642 926 665 $ US | 44 498 165 771 $ US |
| 2003 | 31 005 892 771 $ US | 34 559 267 490 $ US |
| 2002 | 39 314 607 366 $ US | 18 118 954 671 $ US |
| 2001 | 29 016 725 788 $ US | 88 203 254 000 $ US |
| 2000 | 40 723 543 114 $ US | 88 738 714 000 $ US |
| 1999 | 19 806 975 251 $ US | 119 692 913 000 $ US |
| 1998 | 15 714 658 309 $ US | 22 690 500 000 $ US |
| 1997 | 9 433 660 065 $ US | 11 998 300 000 $ US |
| 1996 | 9 801 379 213 $ US | 14 063 900 000 $ US |
| 1995 | 8 281 607 345 $ US | 10 688 700 000 $ US |
| 1994 | 8 772 628 137 $ US | 8 513 580 000 $ US |
| 1993 | 10 808 165 173 $ US | 10 750 000 000 $ US |
| 1992 | 13 275 723 087 $ US | 11 285 800 000 $ US |
| 1991 | 12 492 782 829 $ US | 9 362 560 000 $ US |
| 1990 | 13 983 611 812 $ US | 8 046 730 000 $ US |
| 1989 | 8 428 379 549 $ US | 7 020 270 000 $ US |
| 1988 | 7 020 568 174 $ US | 5 212 470 000 $ US |
| 1987 | 4 570 700 793 $ US | 2 354 920 000 $ US |
| 1986 | 3 450 598 177 $ US | 729 860 000 $ US |
| 1985 | 1 967 804 468 $ US | 1 051 490 000 $ US |
| 1984 | 1 771 829 760 $ US | 389 370 000 $ US |
| 1983 | 1 622 388 936 $ US | 1 289 700 000 $ US |
| 1982 | 1 782 685 066 $ US | 1 472 180 000 $ US |
| 1981 | 1 706 766 879 $ US | 1 386 450 000 $ US |
| 1980 | 1 492 697 190 $ US | 1 544 780 000 $ US |
| 1979 | 1 396 810 449 $ US | 1 130 080 000 $ US |
| 1978 | 1 178 156 262 $ US | 1 435 800 000 $ US |
| 1977 | 607 674 770 $ US | 1 274 930 000 $ US |
| 1976 | 477 622 020 $ US | 871 790 000 $ US |
| 1975 | 682 635 311 $ US | 954 600 000 $ US |
| 1974 | 358 000 000 $ US | 1 137 000 000 $ US |
| 1973 | 390 000 000 $ US | 719 000 000 $ US |
| 1972 | 268 000 000 $ US | 386 000 000 $ US |
| 1971 | 202 000 000 $ US | 428 000 000 $ US |
| 1970 | 222 000 000 $ US | 314 000 000 $ US |
En 2025, les entrées nettes d'investissements directs étrangers étaient de 28,6 milliards de dollars en Espagne et négatives en Belgique, 28,8 milliards de dollars. En 1970, elles étaient de 222 millions de dollars en Espagne et de 314 millions de dollars en Belgique.
Les entrées nettes d'investissements directs étrangers en Espagne ont été supérieures à celles de la Belgique pendant 28 des 56 années de 1970 à 2025, et inférieures pendant 27.
Espagne vs Belgique : dernières entrées et sorties d'investissements étrangers
|
Espagne
|
Belgique
|
|
|---|---|---|
| Entrées nettes | +28,6 Md $US | −28,8 Md $US |
| Entrées nettes, % du PIB | +1,5 % | −4,0 % |
| Sorties nettes | +47,2 Md $US | −19,3 Md $US |
| Entrées nettes, total 2016–2025 | +461 Md $US | −89,4 Md $US |
| Rang mondial | 17/192 | 190/192 |
Comparer les investissements directs étrangers de 2 pays au choix
Sources :
- Banque mondiale | Secteur financier (1970–2025, mis à jour en octobre 2026)
Creative Commons Attribution (CC BY) : vous pouvez copier, partager, adapter et réutiliser ce contenu, y compris à des fins commerciales, à condition de citer statistics.wiki et d’indiquer les modifications apportées. Les sources citées ci-dessus peuvent avoir leurs propres conditions de licence.