
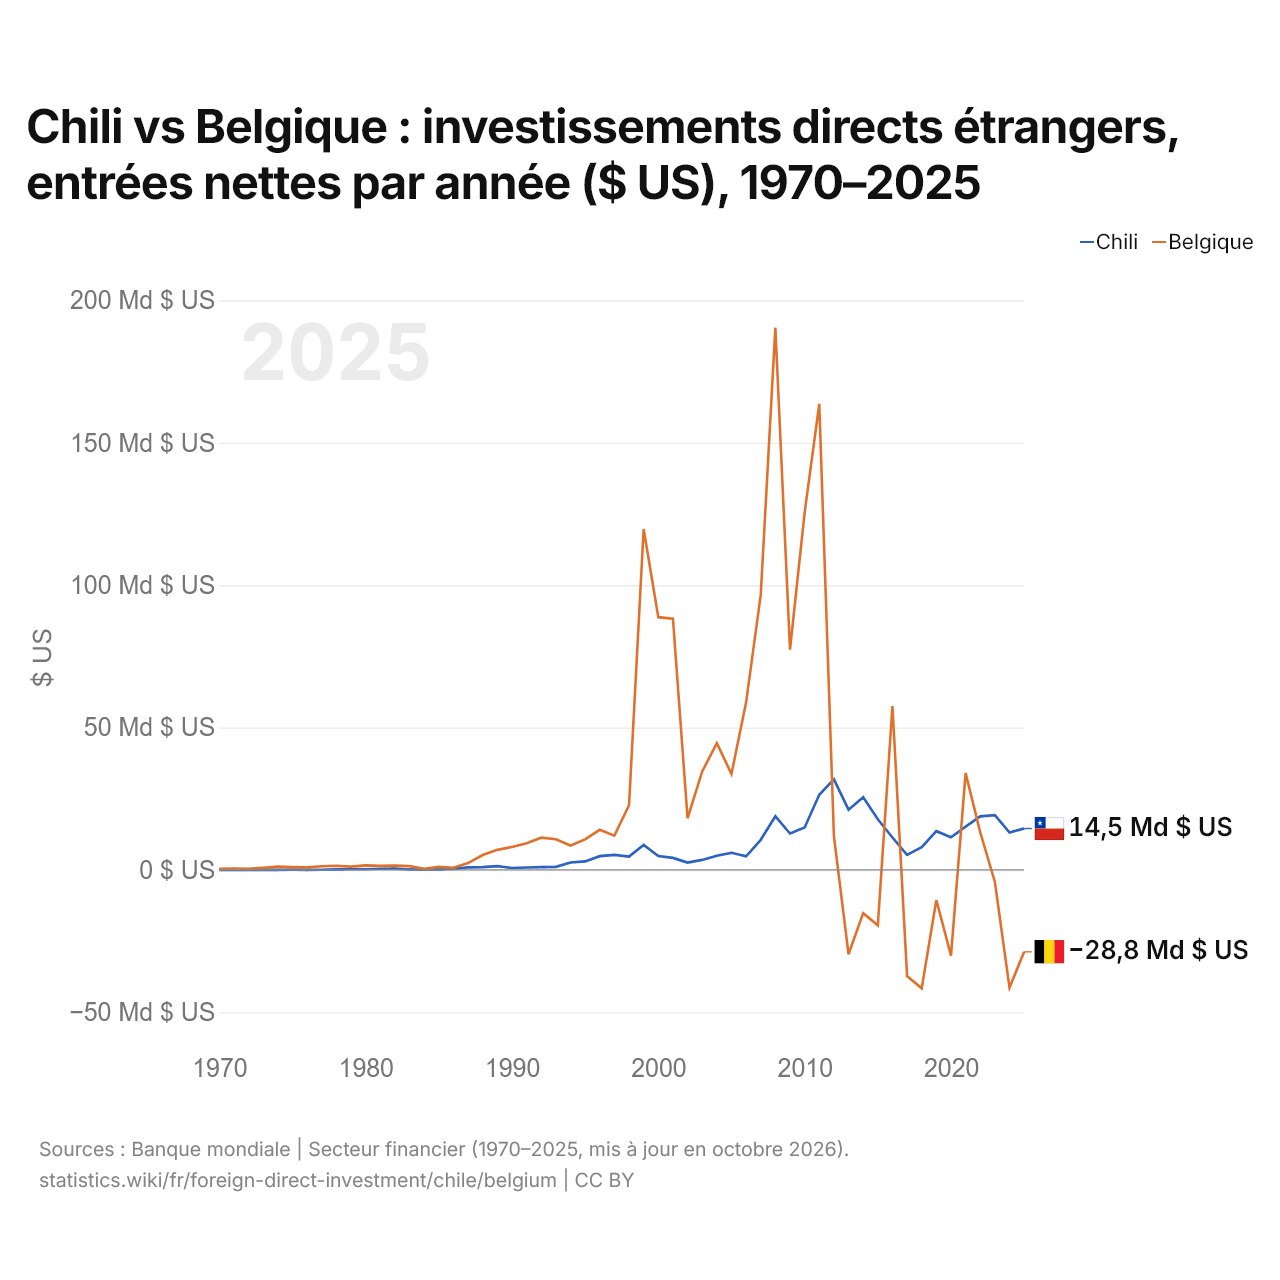
Chili vs Belgique : investissements directs étrangers, entrées nettes par année ($ US), 1970–2025
| Année | $ US | |
|---|---|---|
 Chili |
 Belgique |
|
| 2025 | 14 513 366 156 $ US | −28 789 111 917 $ US |
| 2024 | 13 104 226 085 $ US | −41 357 732 773 $ US |
| 2023 | 19 219 357 027 $ US | −4 247 857 015 $ US |
| 2022 | 18 771 990 469 $ US | 13 136 474 102 $ US |
| 2021 | 15 176 902 319 $ US | 33 980 656 226 $ US |
| 2020 | 11 447 397 289 $ US | −30 140 703 657 $ US |
| 2019 | 13 579 090 979 $ US | −10 587 088 044 $ US |
| 2018 | 7 942 631 935 $ US | −41 601 387 267 $ US |
| 2017 | 5 237 183 518 $ US | −37 288 840 312 $ US |
| 2016 | 11 362 832 162 $ US | 57 538 351 507 $ US |
| 2015 | 17 766 285 629 $ US | −19 514 245 855 $ US |
| 2014 | 25 527 831 849 $ US | −15 205 871 358 $ US |
| 2013 | 21 120 756 844 $ US | −29 640 924 980 $ US |
| 2012 | 31 801 970 676 $ US | 11 810 272 331 $ US |
| 2011 | 26 369 463 389 $ US | 163 624 381 385 $ US |
| 2010 | 14 849 443 157 $ US | 125 491 894 873 $ US |
| 2009 | 12 750 321 999 $ US | 77 354 509 260 $ US |
| 2008 | 18 811 777 951 $ US | 190 391 844 689 $ US |
| 2007 | 10 545 224 588 $ US | 96 551 634 531 $ US |
| 2006 | 4 755 333 483 $ US | 58 821 552 824 $ US |
| 2005 | 5 990 831 829 $ US | 33 662 010 794 $ US |
| 2004 | 4 968 731 408 $ US | 44 498 165 771 $ US |
| 2003 | 3 485 728 422 $ US | 34 559 267 490 $ US |
| 2002 | 2 549 923 142 $ US | 18 118 954 671 $ US |
| 2001 | 4 199 763 049 $ US | 88 203 254 000 $ US |
| 2000 | 4 860 015 668 $ US | 88 738 714 000 $ US |
| 1999 | 8 761 016 218 $ US | 119 692 913 000 $ US |
| 1998 | 4 627 817 978 $ US | 22 690 500 000 $ US |
| 1997 | 5 271 400 000 $ US | 11 998 300 000 $ US |
| 1996 | 4 814 616 000 $ US | 14 063 900 000 $ US |
| 1995 | 2 957 000 000 $ US | 10 688 700 000 $ US |
| 1994 | 2 582 100 000 $ US | 8 513 580 000 $ US |
| 1993 | 1 034 300 000 $ US | 10 750 000 000 $ US |
| 1992 | 936 100 000 $ US | 11 285 800 000 $ US |
| 1991 | 822 700 000 $ US | 9 362 560 000 $ US |
| 1990 | 661 200 000 $ US | 8 046 730 000 $ US |
| 1989 | 1 283 500 000 $ US | 7 020 270 000 $ US |
| 1988 | 967 900 000 $ US | 5 212 470 000 $ US |
| 1987 | 890 500 000 $ US | 2 354 920 000 $ US |
| 1986 | 315 500 000 $ US | 729 860 000 $ US |
| 1985 | 144 300 000 $ US | 1 051 490 000 $ US |
| 1984 | 78 000 000 $ US | 389 370 000 $ US |
| 1983 | 135 000 000 $ US | 1 289 700 000 $ US |
| 1982 | 401 000 000 $ US | 1 472 180 000 $ US |
| 1981 | 383 000 000 $ US | 1 386 450 000 $ US |
| 1980 | 213 000 000 $ US | 1 544 780 000 $ US |
| 1979 | 244 000 000 $ US | 1 130 080 000 $ US |
| 1978 | 181 000 000 $ US | 1 435 800 000 $ US |
| 1977 | 21 000 000 $ US | 1 274 930 000 $ US |
| 1976 | −1 000 000 $ US | 871 790 000 $ US |
| 1975 | 50 000 000 $ US | 954 600 000 $ US |
| 1974 | 2 310 000 $ US | 1 137 000 000 $ US |
| 1973 | −4 800 000 $ US | 719 000 000 $ US |
| 1972 | −1 100 000 $ US | 386 000 000 $ US |
| 1971 | −18 970 000 $ US | 428 000 000 $ US |
| 1970 | 12 330 000 $ US | 314 000 000 $ US |
En 2025, les entrées nettes d'investissements directs étrangers étaient de 14,5 milliards de dollars au Chili et négatives en Belgique, 28,8 milliards de dollars. En 1970, elles étaient de 12,3 millions de dollars au Chili et de 314 millions de dollars en Belgique.
Les entrées nettes d'investissements directs étrangers au Chili ont été supérieures à celles de la Belgique pendant 12 des 56 années de 1970 à 2025, et inférieures pendant 44.
Chili vs Belgique : dernières entrées et sorties d'investissements étrangers
|
Chili
|
Belgique
|
|
|---|---|---|
| Entrées nettes | +14,5 Md $US | −28,8 Md $US |
| Entrées nettes, % du PIB | +4,1 % | −4,0 % |
| Sorties nettes | +8,68 Md $US | −19,3 Md $US |
| Entrées nettes, total 2016–2025 | +130 Md $US | −89,4 Md $US |
| Rang mondial | 28/192 | 190/192 |
Comparer les investissements directs étrangers de 2 pays au choix
Sources :
- Banque mondiale | Secteur financier (1970–2025, mis à jour en octobre 2026)
Creative Commons Attribution (CC BY) : vous pouvez copier, partager, adapter et réutiliser ce contenu, y compris à des fins commerciales, à condition de citer statistics.wiki et d’indiquer les modifications apportées. Les sources citées ci-dessus peuvent avoir leurs propres conditions de licence.