
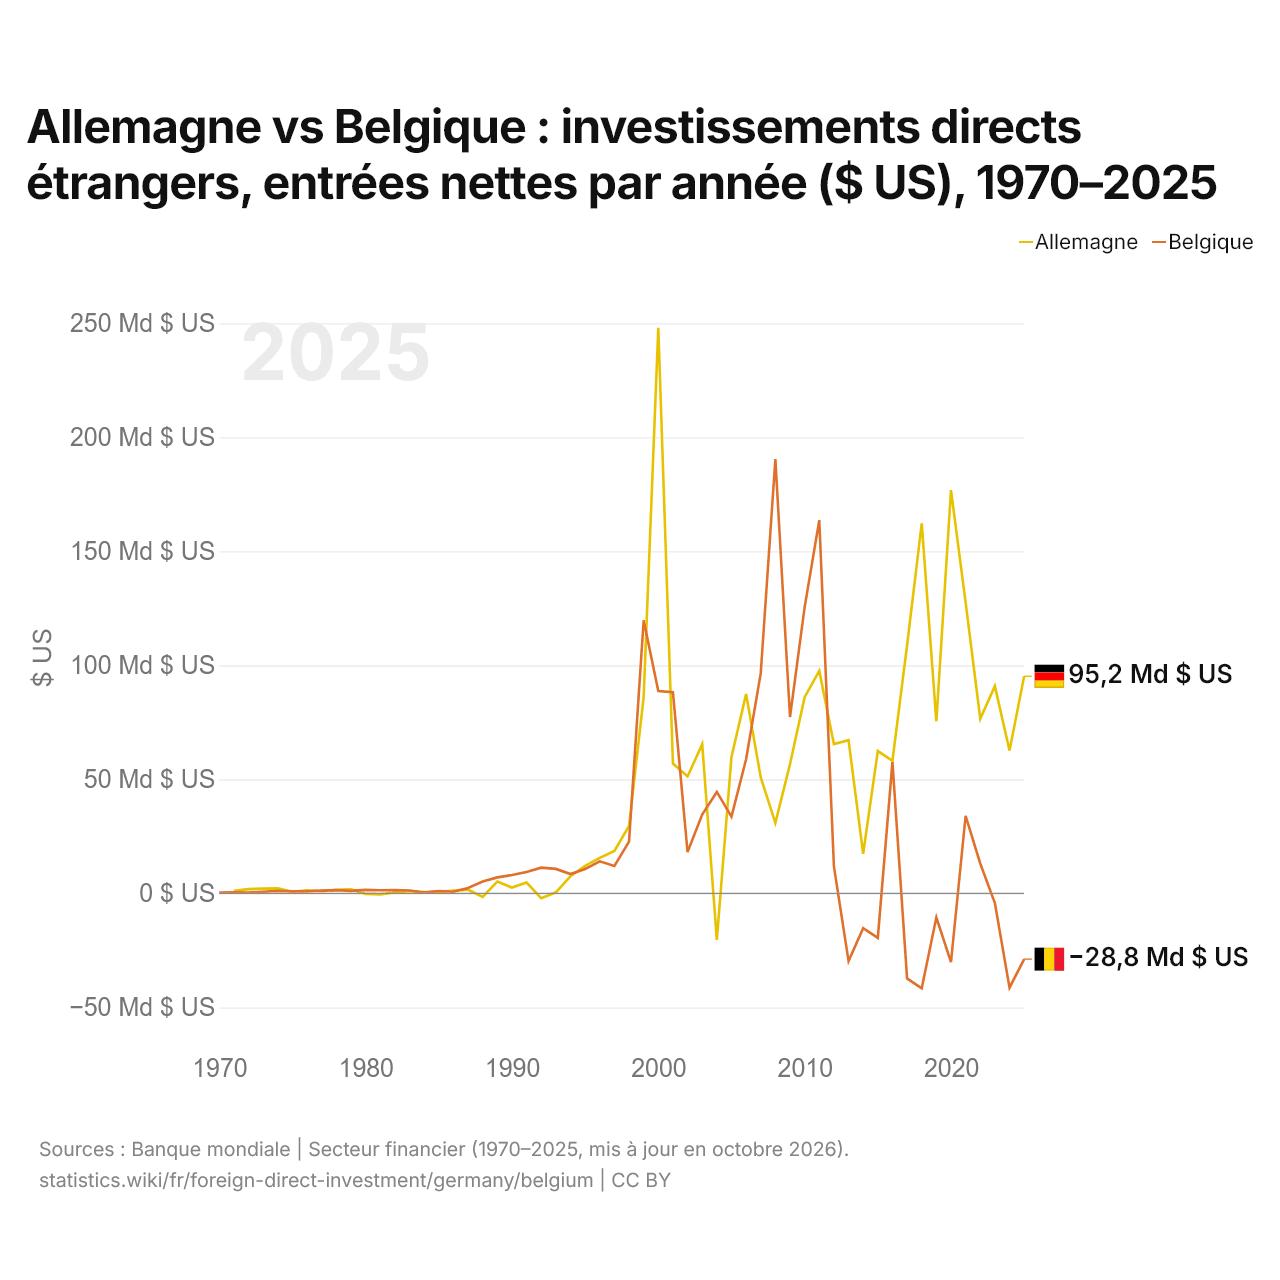
Allemagne vs Belgique : investissements directs étrangers, entrées nettes par année ($ US), 1970–2025
| Année | $ US | |
|---|---|---|
 Allemagne |
 Belgique |
|
| 2025 | 95 190 853 681 $ US | −28 789 111 917 $ US |
| 2024 | 62 637 241 923 $ US | −41 357 732 773 $ US |
| 2023 | 90 884 107 610 $ US | −4 247 857 015 $ US |
| 2022 | 76 571 769 736 $ US | 13 136 474 102 $ US |
| 2021 | 127 609 826 748 $ US | 33 980 656 226 $ US |
| 2020 | 176 781 024 357 $ US | −30 140 703 657 $ US |
| 2019 | 75 463 438 451 $ US | −10 587 088 044 $ US |
| 2018 | 162 250 938 126 $ US | −41 601 387 267 $ US |
| 2017 | 108 786 501 529 $ US | −37 288 840 312 $ US |
| 2016 | 58 132 711 371 $ US | 57 538 351 507 $ US |
| 2015 | 62 418 993 509 $ US | −19 514 245 855 $ US |
| 2014 | 17 356 720 098 $ US | −15 205 871 358 $ US |
| 2013 | 67 199 694 459 $ US | −29 640 924 980 $ US |
| 2012 | 65 443 087 632 $ US | 11 810 272 331 $ US |
| 2011 | 97 535 403 953 $ US | 163 624 381 385 $ US |
| 2010 | 86 037 502 102 $ US | 125 491 894 873 $ US |
| 2009 | 56 701 916 795 $ US | 77 354 509 260 $ US |
| 2008 | 30 954 735 498 $ US | 190 391 844 689 $ US |
| 2007 | 50 847 183 837 $ US | 96 551 634 531 $ US |
| 2006 | 87 444 159 239 $ US | 58 821 552 824 $ US |
| 2005 | 59 835 195 025 $ US | 33 662 010 794 $ US |
| 2004 | −20 408 419 557 $ US | 44 498 165 771 $ US |
| 2003 | 65 401 516 009 $ US | 34 559 267 490 $ US |
| 2002 | 51 268 214 891 $ US | 18 118 954 671 $ US |
| 2001 | 56 948 542 387 $ US | 88 203 254 000 $ US |
| 2000 | 248 007 397 122 $ US | 88 738 714 000 $ US |
| 1999 | 86 035 665 071 $ US | 119 692 913 000 $ US |
| 1998 | 29 525 738 646 $ US | 22 690 500 000 $ US |
| 1997 | 18 638 428 446 $ US | 11 998 300 000 $ US |
| 1996 | 15 590 587 107 $ US | 14 063 900 000 $ US |
| 1995 | 12 040 789 985 $ US | 10 688 700 000 $ US |
| 1994 | 7 517 424 677 $ US | 8 513 580 000 $ US |
| 1993 | 477 658 764 $ US | 10 750 000 000 $ US |
| 1992 | −2 137 482 963 $ US | 11 285 800 000 $ US |
| 1991 | 4 741 546 059 $ US | 9 362 560 000 $ US |
| 1990 | 2 556 702 846 $ US | 8 046 730 000 $ US |
| 1989 | 5 173 426 485 $ US | 7 020 270 000 $ US |
| 1988 | −1 508 574 621 $ US | 5 212 470 000 $ US |
| 1987 | 1 620 170 657 $ US | 2 354 920 000 $ US |
| 1986 | 1 192 024 600 $ US | 729 860 000 $ US |
| 1985 | 531 108 429 $ US | 1 051 490 000 $ US |
| 1984 | 590 664 407 $ US | 389 370 000 $ US |
| 1983 | 997 855 447 $ US | 1 289 700 000 $ US |
| 1982 | 468 263 695 $ US | 1 472 180 000 $ US |
| 1981 | −415 839 560 $ US | 1 386 450 000 $ US |
| 1980 | −186 573 401 $ US | 1 544 780 000 $ US |
| 1979 | 1 732 552 304 $ US | 1 130 080 000 $ US |
| 1978 | 1 603 458 933 $ US | 1 435 800 000 $ US |
| 1977 | 949 983 809 $ US | 1 274 930 000 $ US |
| 1976 | 1 321 369 938 $ US | 871 790 000 $ US |
| 1975 | 690 496 823 $ US | 954 600 000 $ US |
| 1974 | 2 176 992 344 $ US | 1 137 000 000 $ US |
| 1973 | 2 102 302 343 $ US | 719 000 000 $ US |
| 1972 | 1 897 270 696 $ US | 386 000 000 $ US |
| 1971 | 1 103 338 755 $ US | 428 000 000 $ US |
| 1970 | - | 314 000 000 $ US |
En 2025, les entrées nettes d'investissements directs étrangers étaient de 95,2 milliards de dollars en Allemagne et négatives en Belgique, 28,8 milliards de dollars. En 1971, elles étaient de 1,1 milliard de dollars en Allemagne et de 428 millions de dollars en Belgique.
Les entrées nettes d'investissements directs étrangers en Allemagne ont été supérieures à celles de la Belgique pendant 32 des 55 années de 1971 à 2025, et inférieures pendant 23.
Allemagne vs Belgique : dernières entrées et sorties d'investissements étrangers
|
Allemagne
|
Belgique
|
|
|---|---|---|
| Entrées nettes | +95,2 Md $US | −28,8 Md $US |
| Entrées nettes, % du PIB | +1,9 % | −4,0 % |
| Sorties nettes | +108 Md $US | −19,3 Md $US |
| Entrées nettes, total 2016–2025 | +1,03 Bn $US | −89,4 Md $US |
| Rang mondial | 3/192 | 190/192 |
Comparer les investissements directs étrangers de 2 pays au choix
Sources :
- Banque mondiale | Secteur financier (1970–2025, mis à jour en octobre 2026)
Creative Commons Attribution (CC BY) : vous pouvez copier, partager, adapter et réutiliser ce contenu, y compris à des fins commerciales, à condition de citer statistics.wiki et d’indiquer les modifications apportées. Les sources citées ci-dessus peuvent avoir leurs propres conditions de licence.