
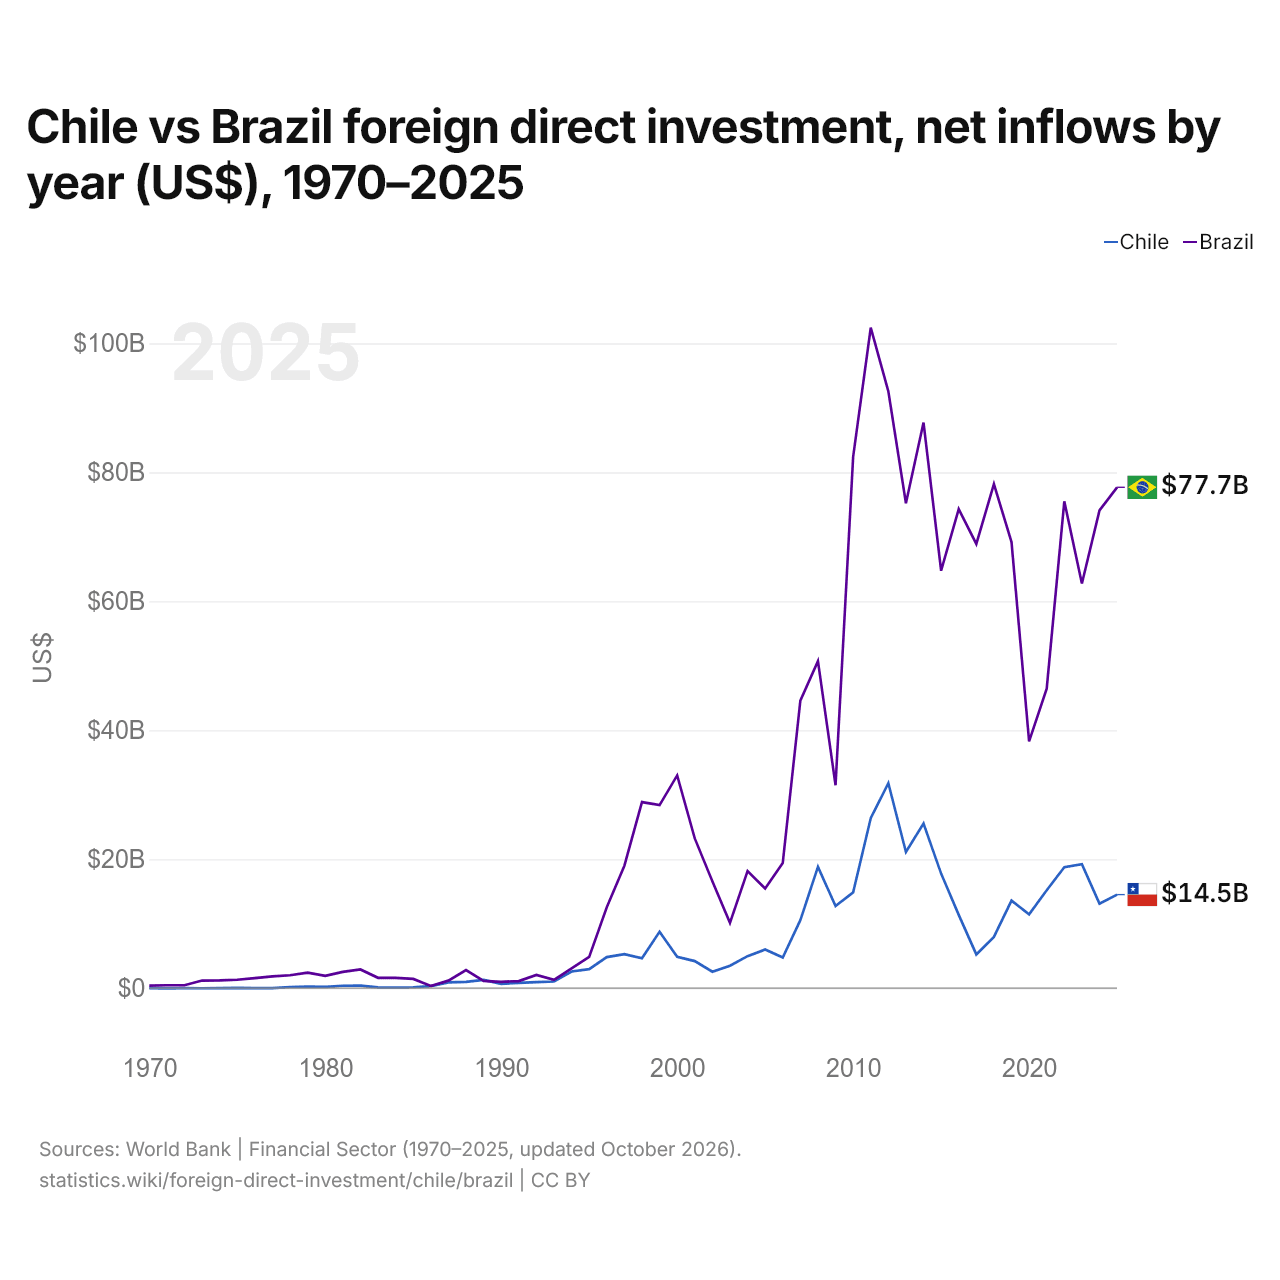
Chili vs Brésil : investissements directs étrangers, entrées nettes par année ($ US), 1970–2025
| Année | $ US | |
|---|---|---|
 Chili |
 Brésil |
|
| 2025 | 14 513 366 156 $ US | 77 676 162 912 $ US |
| 2024 | 13 104 226 085 $ US | 74 090 786 050 $ US |
| 2023 | 19 219 357 027 $ US | 62 750 364 285 $ US |
| 2022 | 18 771 990 469 $ US | 75 501 038 733 $ US |
| 2021 | 15 176 902 319 $ US | 46 440 503 520 $ US |
| 2020 | 11 447 397 289 $ US | 38 270 116 307 $ US |
| 2019 | 13 579 090 979 $ US | 69 174 411 753 $ US |
| 2018 | 7 942 631 935 $ US | 78 183 840 045 $ US |
| 2017 | 5 237 183 518 $ US | 68 885 491 315 $ US |
| 2016 | 11 362 832 162 $ US | 74 294 627 801 $ US |
| 2015 | 17 766 285 629 $ US | 64 738 153 494 $ US |
| 2014 | 25 527 831 849 $ US | 87 713 983 217 $ US |
| 2013 | 21 120 756 844 $ US | 75 211 029 129 $ US |
| 2012 | 31 801 970 676 $ US | 92 568 388 321 $ US |
| 2011 | 26 369 463 389 $ US | 102 427 228 231 $ US |
| 2010 | 14 849 443 157 $ US | 82 389 932 468 $ US |
| 2009 | 12 750 321 999 $ US | 31 480 931 700 $ US |
| 2008 | 18 811 777 951 $ US | 50 716 402 711 $ US |
| 2007 | 10 545 224 588 $ US | 44 579 492 464 $ US |
| 2006 | 4 755 333 483 $ US | 19 418 085 598 $ US |
| 2005 | 5 990 831 829 $ US | 15 459 981 604 $ US |
| 2004 | 4 968 731 408 $ US | 18 161 380 460 $ US |
| 2003 | 3 485 728 422 $ US | 10 123 013 671 $ US |
| 2002 | 2 549 923 142 $ US | 16 586 600 193 $ US |
| 2001 | 4 199 763 049 $ US | 23 225 846 372 $ US |
| 2000 | 4 860 015 668 $ US | 32 994 718 700 $ US |
| 1999 | 8 761 016 218 $ US | 28 385 675 615 $ US |
| 1998 | 4 627 817 978 $ US | 28 855 609 916 $ US |
| 1997 | 5 271 400 000 $ US | 18 992 934 311 $ US |
| 1996 | 4 814 616 000 $ US | 12 552 000 000 $ US |
| 1995 | 2 957 000 000 $ US | 4 859 000 000 $ US |
| 1994 | 2 582 100 000 $ US | 3 072 000 000 $ US |
| 1993 | 1 034 300 000 $ US | 1 292 000 000 $ US |
| 1992 | 936 100 000 $ US | 2 061 000 000 $ US |
| 1991 | 822 700 000 $ US | 1 103 000 000 $ US |
| 1990 | 661 200 000 $ US | 989 000 000 $ US |
| 1989 | 1 283 500 000 $ US | 1 131 000 000 $ US |
| 1988 | 967 900 000 $ US | 2 804 000 000 $ US |
| 1987 | 890 500 000 $ US | 1 169 000 000 $ US |
| 1986 | 315 500 000 $ US | 345 000 000 $ US |
| 1985 | 144 300 000 $ US | 1 441 000 000 $ US |
| 1984 | 78 000 000 $ US | 1 594 000 000 $ US |
| 1983 | 135 000 000 $ US | 1 609 000 000 $ US |
| 1982 | 401 000 000 $ US | 2 910 000 000 $ US |
| 1981 | 383 000 000 $ US | 2 520 000 000 $ US |
| 1980 | 213 000 000 $ US | 1 911 000 000 $ US |
| 1979 | 244 000 000 $ US | 2 419 000 000 $ US |
| 1978 | 181 000 000 $ US | 2 006 000 000 $ US |
| 1977 | 21 000 000 $ US | 1 833 000 000 $ US |
| 1976 | −1 000 000 $ US | 1 555 000 000 $ US |
| 1975 | 50 000 000 $ US | 1 302 000 000 $ US |
| 1974 | 2 310 000 $ US | 1 207 900 000 $ US |
| 1973 | −4 800 000 $ US | 1 180 700 000 $ US |
| 1972 | −1 100 000 $ US | 459 900 000 $ US |
| 1971 | −18 970 000 $ US | 449 000 000 $ US |
| 1970 | 12 330 000 $ US | 391 700 000 $ US |
En 2025, les entrées nettes d'investissements directs étrangers étaient de 14,5 milliards de dollars au Chili et de 77,7 milliards de dollars au Brésil : 5,4 fois plus au Brésil. En 1970, elles étaient de 12,3 millions de dollars au Chili et de 392 millions de dollars au Brésil.
Les entrées nettes d'investissements directs étrangers au Chili ont été supérieures à celles du Brésil pendant une des 56 années de 1970 à 2025, et inférieures pendant 55.
Chili vs Brésil : dernières entrées et sorties d'investissements étrangers
|
Chili
|
Brésil
|
|
|---|---|---|
| Entrées nettes | +14,5 Md $US | +77,7 Md $US |
| Entrées nettes, % du PIB | +4,1 % | +3,4 % |
| Sorties nettes | +8,68 Md $US | +30,2 Md $US |
| Entrées nettes, total 2016–2025 | +130 Md $US | +665 Md $US |
| Rang mondial | 28/192 | 5/192 |
Comparer les investissements directs étrangers de 2 pays au choix
Sources :
- Banque mondiale | Secteur financier (1970–2025, mis à jour en octobre 2026)
Creative Commons Attribution (CC BY) : vous pouvez copier, partager, adapter et réutiliser ce contenu, y compris à des fins commerciales, à condition de citer statistics.wiki et d’indiquer les modifications apportées. Les sources citées ci-dessus peuvent avoir leurs propres conditions de licence.