
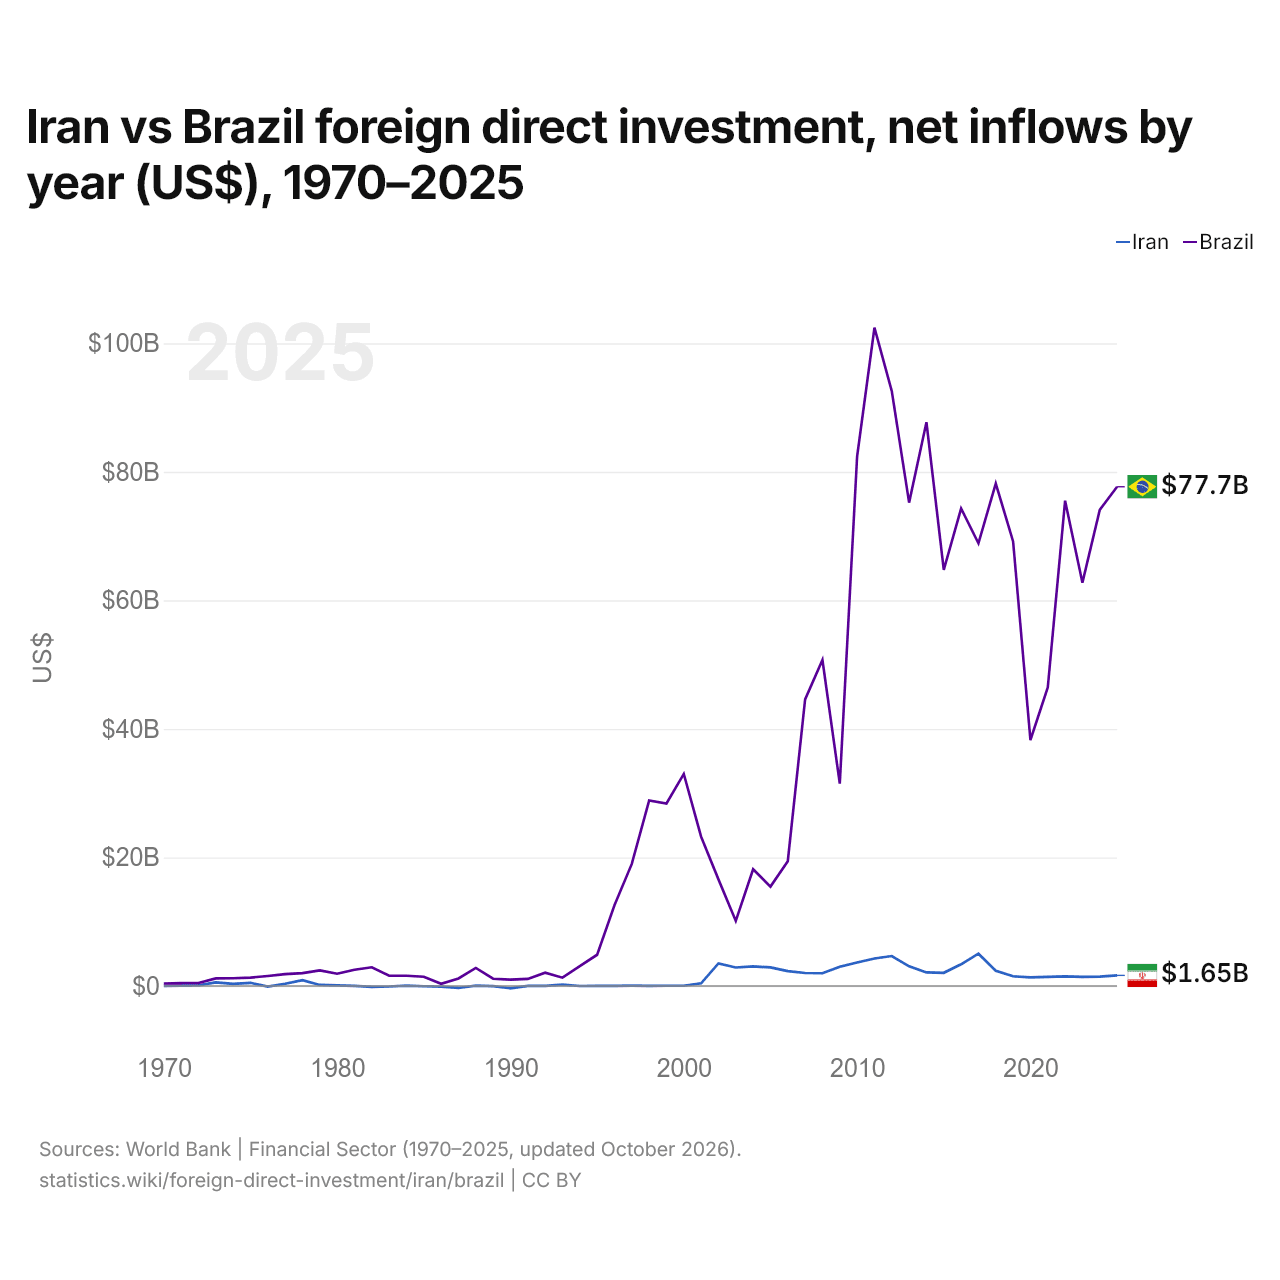
Iran vs Brésil : investissements directs étrangers, entrées nettes par année ($ US), 1970–2025
| Année | $ US | |
|---|---|---|
 Iran |
 Brésil |
|
| 2025 | 1 646 577 407 $ US | 77 676 162 912 $ US |
| 2024 | 1 449 111 111 $ US | 74 090 786 050 $ US |
| 2023 | 1 422 333 333 $ US | 62 750 364 285 $ US |
| 2022 | 1 500 000 000 $ US | 75 501 038 733 $ US |
| 2021 | 1 425 000 000 $ US | 46 440 503 520 $ US |
| 2020 | 1 342 000 000 $ US | 38 270 116 307 $ US |
| 2019 | 1 508 000 000 $ US | 69 174 411 753 $ US |
| 2018 | 2 373 000 000 $ US | 78 183 840 045 $ US |
| 2017 | 5 019 000 000 $ US | 68 885 491 315 $ US |
| 2016 | 3 372 000 000 $ US | 74 294 627 801 $ US |
| 2015 | 2 050 000 000 $ US | 64 738 153 494 $ US |
| 2014 | 2 105 494 000 $ US | 87 713 983 217 $ US |
| 2013 | 3 049 945 000 $ US | 75 211 029 129 $ US |
| 2012 | 4 661 734 400 $ US | 92 568 388 321 $ US |
| 2011 | 4 276 718 690 $ US | 102 427 228 231 $ US |
| 2010 | 3 648 972 410 $ US | 82 389 932 468 $ US |
| 2009 | 2 983 421 910 $ US | 31 480 931 700 $ US |
| 2008 | 1 979 988 010 $ US | 50 716 402 711 $ US |
| 2007 | 2 017 791 750 $ US | 44 579 492 464 $ US |
| 2006 | 2 317 538 500 $ US | 19 418 085 598 $ US |
| 2005 | 2 889 191 670 $ US | 15 459 981 604 $ US |
| 2004 | 3 037 299 840 $ US | 18 161 380 460 $ US |
| 2003 | 2 877 481 500 $ US | 10 123 013 671 $ US |
| 2002 | 3 519 380 360 $ US | 16 586 600 193 $ US |
| 2001 | 408 118 760 $ US | 23 225 846 372 $ US |
| 2000 | 39 000 000 $ US | 32 994 718 700 $ US |
| 1999 | 35 000 000 $ US | 28 385 675 615 $ US |
| 1998 | 24 000 000 $ US | 28 855 609 916 $ US |
| 1997 | 53 000 000 $ US | 18 992 934 311 $ US |
| 1996 | 26 000 000 $ US | 12 552 000 000 $ US |
| 1995 | 17 000 000 $ US | 4 859 000 000 $ US |
| 1994 | 2 000 000 $ US | 3 072 000 000 $ US |
| 1993 | 207 550 000 $ US | 1 292 000 000 $ US |
| 1992 | 8 500 000 $ US | 2 061 000 000 $ US |
| 1991 | 22 590 000 $ US | 1 103 000 000 $ US |
| 1990 | −361 950 000 $ US | 989 000 000 $ US |
| 1989 | −19 420 000 $ US | 1 131 000 000 $ US |
| 1988 | 60 540 000 $ US | 2 804 000 000 $ US |
| 1987 | −307 630 000 $ US | 1 169 000 000 $ US |
| 1986 | −112 440 000 $ US | 345 000 000 $ US |
| 1985 | −38 150 000 $ US | 1 441 000 000 $ US |
| 1984 | 42 690 000 $ US | 1 594 000 000 $ US |
| 1983 | −78 520 000 $ US | 1 609 000 000 $ US |
| 1982 | −136 090 000 $ US | 2 910 000 000 $ US |
| 1981 | 28 220 000 $ US | 2 520 000 000 $ US |
| 1980 | 80 910 000 $ US | 1 911 000 000 $ US |
| 1979 | 164 350 000 $ US | 2 419 000 000 $ US |
| 1978 | 909 060 000 $ US | 2 006 000 000 $ US |
| 1977 | 345 690 000 $ US | 1 833 000 000 $ US |
| 1976 | −101 590 000 $ US | 1 555 000 000 $ US |
| 1975 | 494 400 000 $ US | 1 302 000 000 $ US |
| 1974 | 323 500 000 $ US | 1 207 900 000 $ US |
| 1973 | 561 500 000 $ US | 1 180 700 000 $ US |
| 1972 | 91 200 000 $ US | 459 900 000 $ US |
| 1971 | 65 200 000 $ US | 449 000 000 $ US |
| 1970 | 28 000 000 $ US | 391 700 000 $ US |
En 2025, les entrées nettes d'investissements directs étrangers étaient de 1,65 milliard de dollars en Iran et de 77,7 milliards de dollars au Brésil : 47 fois plus au Brésil. En 1970, elles étaient de 28 millions de dollars en Iran et de 392 millions de dollars au Brésil.
Les entrées nettes d'investissements directs étrangers en Iran ont été inférieures à celles du Brésil chacune des 56 années de 1970 à 2025.
Iran vs Brésil : dernières entrées et sorties d'investissements étrangers
|
Iran
|
Brésil
|
|
|---|---|---|
| Entrées nettes | +1,65 Md $US | +77,7 Md $US |
| Entrées nettes, % du PIB | +0,5 % | +3,4 % |
| Sorties nettes | +104 M $US | +30,2 Md $US |
| Entrées nettes, total 2016–2025 | +21,1 Md $US | +665 Md $US |
| Rang mondial | 78/192 | 5/192 |
Comparer les investissements directs étrangers de 2 pays au choix
Sources :
- Banque mondiale | Secteur financier (1970–2025, mis à jour en octobre 2026)
Creative Commons Attribution (CC BY) : vous pouvez copier, partager, adapter et réutiliser ce contenu, y compris à des fins commerciales, à condition de citer statistics.wiki et d’indiquer les modifications apportées. Les sources citées ci-dessus peuvent avoir leurs propres conditions de licence.