
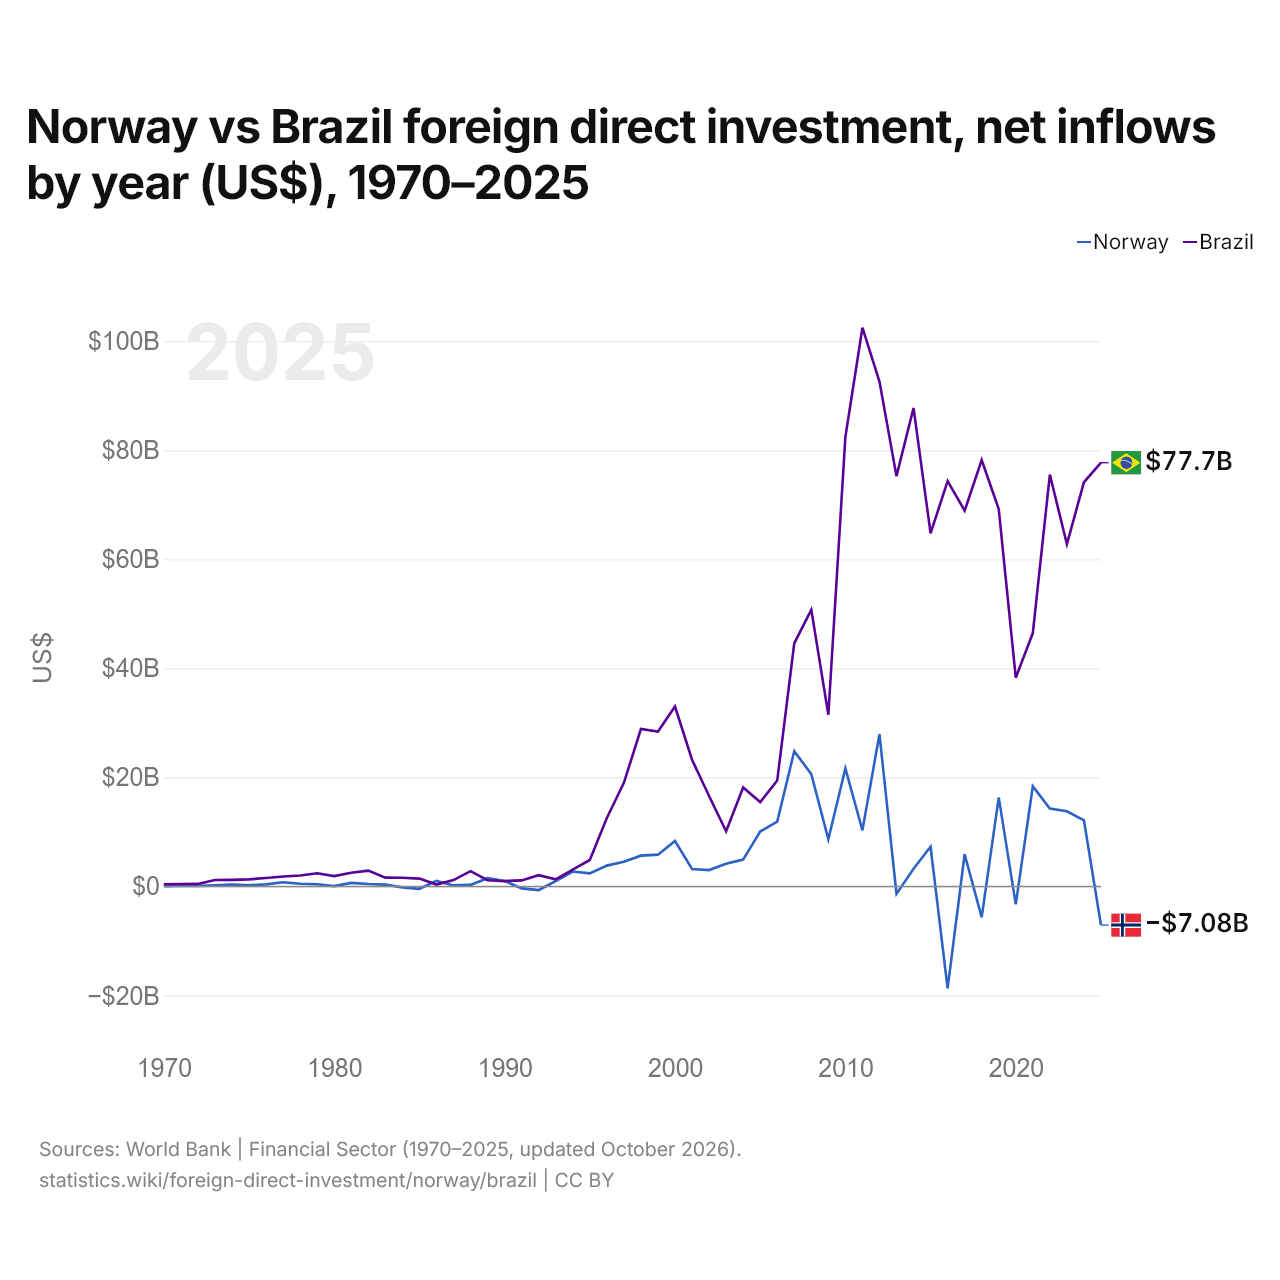
Norvège vs Brésil : investissements directs étrangers, entrées nettes par année ($ US), 1970–2025
| Année | $ US | |
|---|---|---|
 Norvège |
 Brésil |
|
| 2025 | −7 079 264 326 $ US | 77 676 162 912 $ US |
| 2024 | 12 133 906 455 $ US | 74 090 786 050 $ US |
| 2023 | 13 785 279 525 $ US | 62 750 364 285 $ US |
| 2022 | 14 278 134 699 $ US | 75 501 038 733 $ US |
| 2021 | 18 355 008 694 $ US | 46 440 503 520 $ US |
| 2020 | −3 281 320 957 $ US | 38 270 116 307 $ US |
| 2019 | 16 329 824 318 $ US | 69 174 411 753 $ US |
| 2018 | −5 664 319 362 $ US | 78 183 840 045 $ US |
| 2017 | 5 900 604 724 $ US | 68 885 491 315 $ US |
| 2016 | −18 668 572 814 $ US | 74 294 627 801 $ US |
| 2015 | 7 274 086 872 $ US | 64 738 153 494 $ US |
| 2014 | 3 242 240 088 $ US | 87 713 983 217 $ US |
| 2013 | −1 368 607 171 $ US | 75 211 029 129 $ US |
| 2012 | 27 897 968 328 $ US | 92 568 388 321 $ US |
| 2011 | 10 296 323 076 $ US | 102 427 228 231 $ US |
| 2010 | 21 634 265 663 $ US | 82 389 932 468 $ US |
| 2009 | 8 635 762 892 $ US | 31 480 931 700 $ US |
| 2008 | 20 578 219 685 $ US | 50 716 402 711 $ US |
| 2007 | 24 806 091 103 $ US | 44 579 492 464 $ US |
| 2006 | 11 877 923 790 $ US | 19 418 085 598 $ US |
| 2005 | 10 058 759 830 $ US | 15 459 981 604 $ US |
| 2004 | 4 918 494 986 $ US | 18 161 380 460 $ US |
| 2003 | 4 179 380 423 $ US | 10 123 013 671 $ US |
| 2002 | 3 011 752 930 $ US | 16 586 600 193 $ US |
| 2001 | 3 190 216 069 $ US | 23 225 846 372 $ US |
| 2000 | 8 332 062 186 $ US | 32 994 718 700 $ US |
| 1999 | 5 822 113 546 $ US | 28 385 675 615 $ US |
| 1998 | 5 645 870 321 $ US | 28 855 609 916 $ US |
| 1997 | 4 514 609 380 $ US | 18 992 934 311 $ US |
| 1996 | 3 827 495 491 $ US | 12 552 000 000 $ US |
| 1995 | 2 392 766 980 $ US | 4 859 000 000 $ US |
| 1994 | 2 736 393 920 $ US | 3 072 000 000 $ US |
| 1993 | 991 524 095 $ US | 1 292 000 000 $ US |
| 1992 | −668 114 803 $ US | 2 061 000 000 $ US |
| 1991 | −353 675 744 $ US | 1 103 000 000 $ US |
| 1990 | 1 001 987 072 $ US | 989 000 000 $ US |
| 1989 | 1 510 287 425 $ US | 1 131 000 000 $ US |
| 1988 | 280 910 587 $ US | 2 804 000 000 $ US |
| 1987 | 190 047 506 $ US | 1 169 000 000 $ US |
| 1986 | 1 018 718 112 $ US | 345 000 000 $ US |
| 1985 | −424 225 257 $ US | 1 441 000 000 $ US |
| 1984 | −177 399 976 $ US | 1 594 000 000 $ US |
| 1983 | 332 396 808 $ US | 1 609 000 000 $ US |
| 1982 | 450 026 120 $ US | 2 910 000 000 $ US |
| 1981 | 668 006 461 $ US | 2 520 000 000 $ US |
| 1980 | 59 815 998 $ US | 1 911 000 000 $ US |
| 1979 | 401 356 278 $ US | 2 419 000 000 $ US |
| 1978 | 489 814 168 $ US | 2 006 000 000 $ US |
| 1977 | 768 296 210 $ US | 1 833 000 000 $ US |
| 1976 | 371 391 272 $ US | 1 555 000 000 $ US |
| 1975 | 219 677 310 $ US | 1 302 000 000 $ US |
| 1974 | 346 000 000 $ US | 1 207 900 000 $ US |
| 1973 | 209 000 000 $ US | 1 180 700 000 $ US |
| 1972 | 121 000 000 $ US | 459 900 000 $ US |
| 1971 | 94 000 000 $ US | 449 000 000 $ US |
| 1970 | 64 000 000 $ US | 391 700 000 $ US |
En 2025, les entrées nettes d'investissements directs étrangers étaient négatives en Norvège, 7,08 milliards de dollars et de 77,7 milliards de dollars au Brésil. En 1970, elles étaient de 64 millions de dollars en Norvège et de 392 millions de dollars au Brésil.
Les entrées nettes d'investissements directs étrangers en Norvège ont été supérieures à celles du Brésil pendant 3 des 56 années de 1970 à 2025, et inférieures pendant 53.
Norvège vs Brésil : dernières entrées et sorties d'investissements étrangers
|
Norvège
|
Brésil
|
|
|---|---|---|
| Entrées nettes | −7,08 Md $US | +77,7 Md $US |
| Entrées nettes, % du PIB | −1,3 % | +3,4 % |
| Sorties nettes | +3,37 Md $US | +30,2 Md $US |
| Entrées nettes, total 2016–2025 | +46,1 Md $US | +665 Md $US |
| Rang mondial | 187/192 | 5/192 |
Comparer les investissements directs étrangers de 2 pays au choix
Sources :
- Banque mondiale | Secteur financier (1970–2025, mis à jour en octobre 2026)
Creative Commons Attribution (CC BY) : vous pouvez copier, partager, adapter et réutiliser ce contenu, y compris à des fins commerciales, à condition de citer statistics.wiki et d’indiquer les modifications apportées. Les sources citées ci-dessus peuvent avoir leurs propres conditions de licence.