
États-Unis vs Norvège : investissements directs étrangers, entrées nettes par année ($ US), 1970–2025
| Année | $ US | |
|---|---|---|
 États-Unis |
 Norvège |
|
| 2025 | 307 018 000 000 $ US | −7 079 264 326 $ US |
| 2024 | 248 584 000 000 $ US | 12 133 906 455 $ US |
| 2023 | 349 697 000 000 $ US | 13 785 279 525 $ US |
| 2022 | 425 816 000 000 $ US | 14 278 134 699 $ US |
| 2021 | 477 956 000 000 $ US | 18 355 008 694 $ US |
| 2020 | 137 066 000 000 $ US | −3 281 320 957 $ US |
| 2019 | 315 984 000 000 $ US | 16 329 824 318 $ US |
| 2018 | 214 715 000 000 $ US | −5 664 319 362 $ US |
| 2017 | 380 823 000 000 $ US | 5 900 604 724 $ US |
| 2016 | 474 388 000 000 $ US | −18 668 572 814 $ US |
| 2015 | 511 434 000 000 $ US | 7 274 086 872 $ US |
| 2014 | 251 856 000 000 $ US | 3 242 240 088 $ US |
| 2013 | 288 131 000 000 $ US | −1 368 607 171 $ US |
| 2012 | 250 345 000 000 $ US | 27 897 968 328 $ US |
| 2011 | 263 497 000 000 $ US | 10 296 323 076 $ US |
| 2010 | 264 039 000 000 $ US | 21 634 265 663 $ US |
| 2009 | 161 083 000 000 $ US | 8 635 762 892 $ US |
| 2008 | 341 092 000 000 $ US | 20 578 219 685 $ US |
| 2007 | 346 613 000 000 $ US | 24 806 091 103 $ US |
| 2006 | 298 463 000 000 $ US | 11 877 923 790 $ US |
| 2005 | 142 344 000 000 $ US | 10 058 759 830 $ US |
| 2004 | 213 641 000 000 $ US | 4 918 494 986 $ US |
| 2003 | 117 106 000 000 $ US | 4 179 380 423 $ US |
| 2002 | 111 055 000 000 $ US | 3 011 752 930 $ US |
| 2001 | 172 496 000 000 $ US | 3 190 216 069 $ US |
| 2000 | 349 125 000 000 $ US | 8 332 062 186 $ US |
| 1999 | 312 449 000 000 $ US | 5 822 113 546 $ US |
| 1998 | 211 150 000 000 $ US | 5 645 870 321 $ US |
| 1997 | 122 150 000 000 $ US | 4 514 609 380 $ US |
| 1996 | 97 660 000 000 $ US | 3 827 495 491 $ US |
| 1995 | 69 080 000 000 $ US | 2 392 766 980 $ US |
| 1994 | 55 940 000 000 $ US | 2 736 393 920 $ US |
| 1993 | 50 230 000 000 $ US | 991 524 095 $ US |
| 1992 | 30 310 000 000 $ US | −668 114 803 $ US |
| 1991 | 34 550 000 000 $ US | −353 675 744 $ US |
| 1990 | 71 230 000 000 $ US | 1 001 987 072 $ US |
| 1989 | 75 780 000 000 $ US | 1 510 287 425 $ US |
| 1988 | 56 910 000 000 $ US | 280 910 587 $ US |
| 1987 | 63 235 000 000 $ US | 190 047 506 $ US |
| 1986 | 30 946 000 000 $ US | 1 018 718 112 $ US |
| 1985 | 9 630 000 000 $ US | −424 225 257 $ US |
| 1984 | 25 230 000 000 $ US | −177 399 976 $ US |
| 1983 | 11 500 000 000 $ US | 332 396 808 $ US |
| 1982 | 21 230 000 000 $ US | 450 026 120 $ US |
| 1981 | 25 680 000 000 $ US | 668 006 461 $ US |
| 1980 | 16 740 000 000 $ US | 59 815 998 $ US |
| 1979 | 8 050 000 000 $ US | 401 356 278 $ US |
| 1978 | 5 500 000 000 $ US | 489 814 168 $ US |
| 1977 | 2 920 000 000 $ US | 768 296 210 $ US |
| 1976 | 2 910 000 000 $ US | 371 391 272 $ US |
| 1975 | 2 310 000 000 $ US | 219 677 310 $ US |
| 1974 | 3 540 000 000 $ US | 346 000 000 $ US |
| 1973 | 1 930 000 000 $ US | 209 000 000 $ US |
| 1972 | 1 270 000 000 $ US | 121 000 000 $ US |
| 1971 | 770 000 000 $ US | 94 000 000 $ US |
| 1970 | 1 220 000 000 $ US | 64 000 000 $ US |
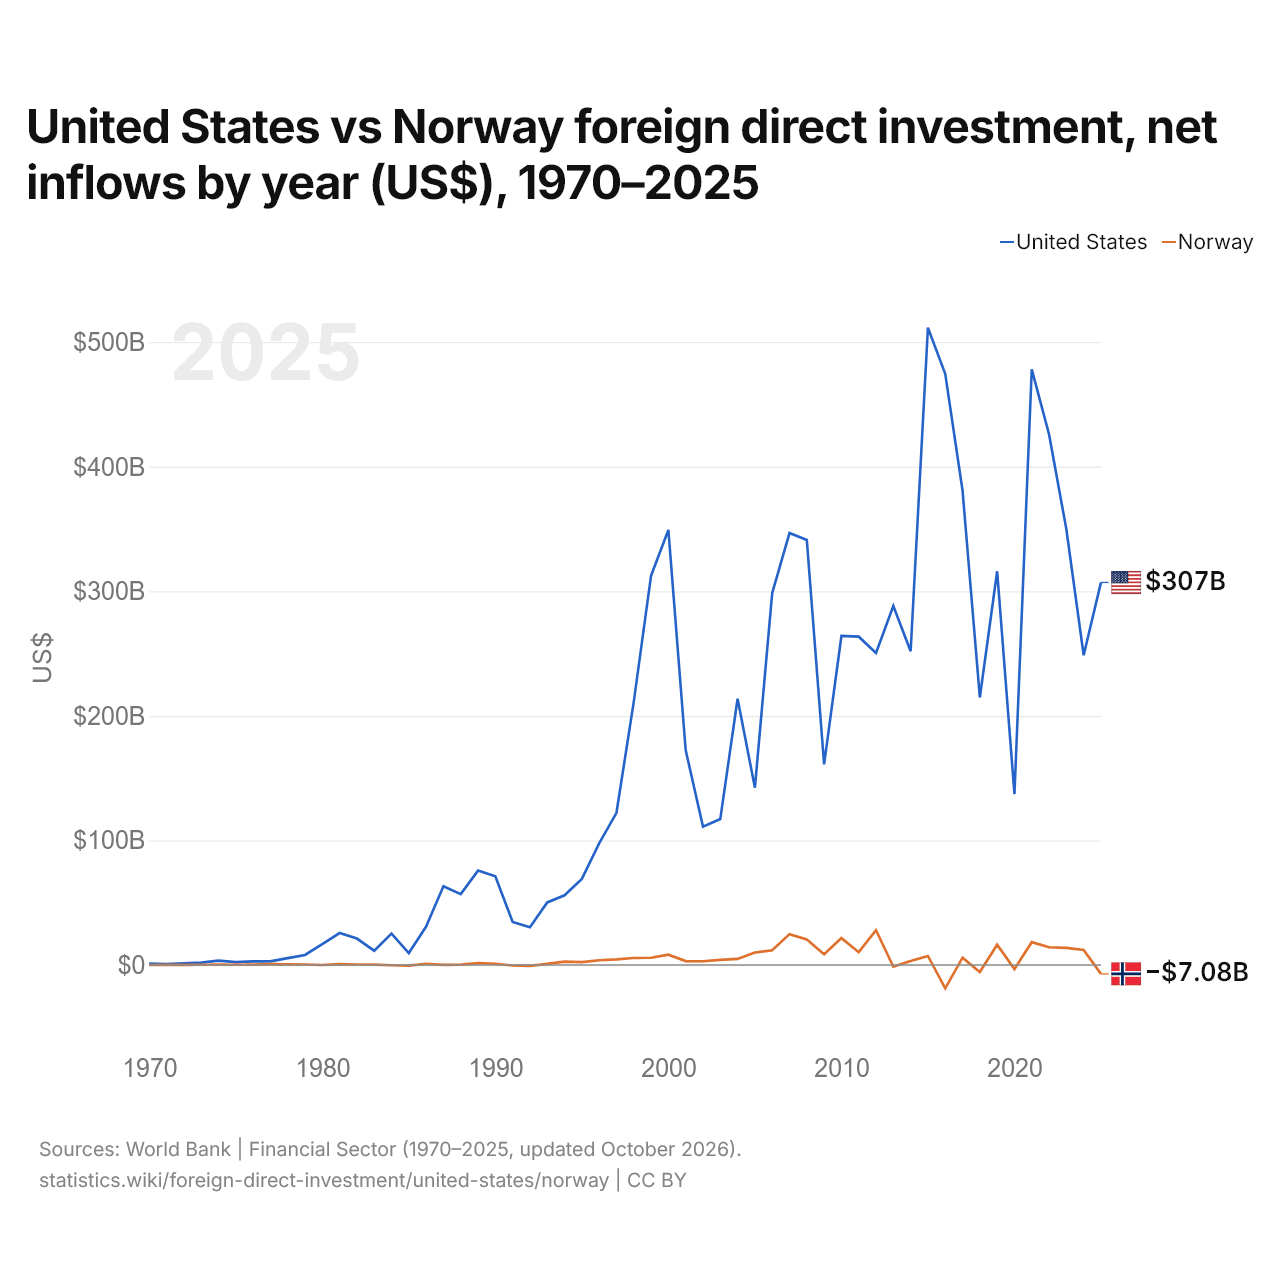
En 2025, les entrées nettes d'investissements directs étrangers étaient de 307 milliards de dollars aux États-Unis et négatives en Norvège, 7,08 milliards de dollars. En 1970, elles étaient de 1,22 milliard de dollars aux États-Unis et de 64 millions de dollars en Norvège.
Les entrées nettes d'investissements directs étrangers aux États-Unis ont été supérieures à celles de la Norvège chacune des 56 années de 1970 à 2025.
États-Unis vs Norvège : dernières entrées et sorties d'investissements étrangers
|
États-Unis
|
Norvège
|
|
|---|---|---|
| Entrées nettes | +307 Md $US | −7,08 Md $US |
| Entrées nettes, % du PIB | +1,0 % | −1,3 % |
| Sorties nettes | +390 Md $US | +3,37 Md $US |
| Entrées nettes, total 2016–2025 | +3,33 Bn $US | +46,1 Md $US |
| Rang mondial | 1/192 | 187/192 |
Comparer les investissements directs étrangers de 2 pays au choix
Sources :
- Banque mondiale | Secteur financier (1970–2025, mis à jour en octobre 2026)
Creative Commons Attribution (CC BY) : vous pouvez copier, partager, adapter et réutiliser ce contenu, y compris à des fins commerciales, à condition de citer statistics.wiki et d’indiquer les modifications apportées. Les sources citées ci-dessus peuvent avoir leurs propres conditions de licence.