
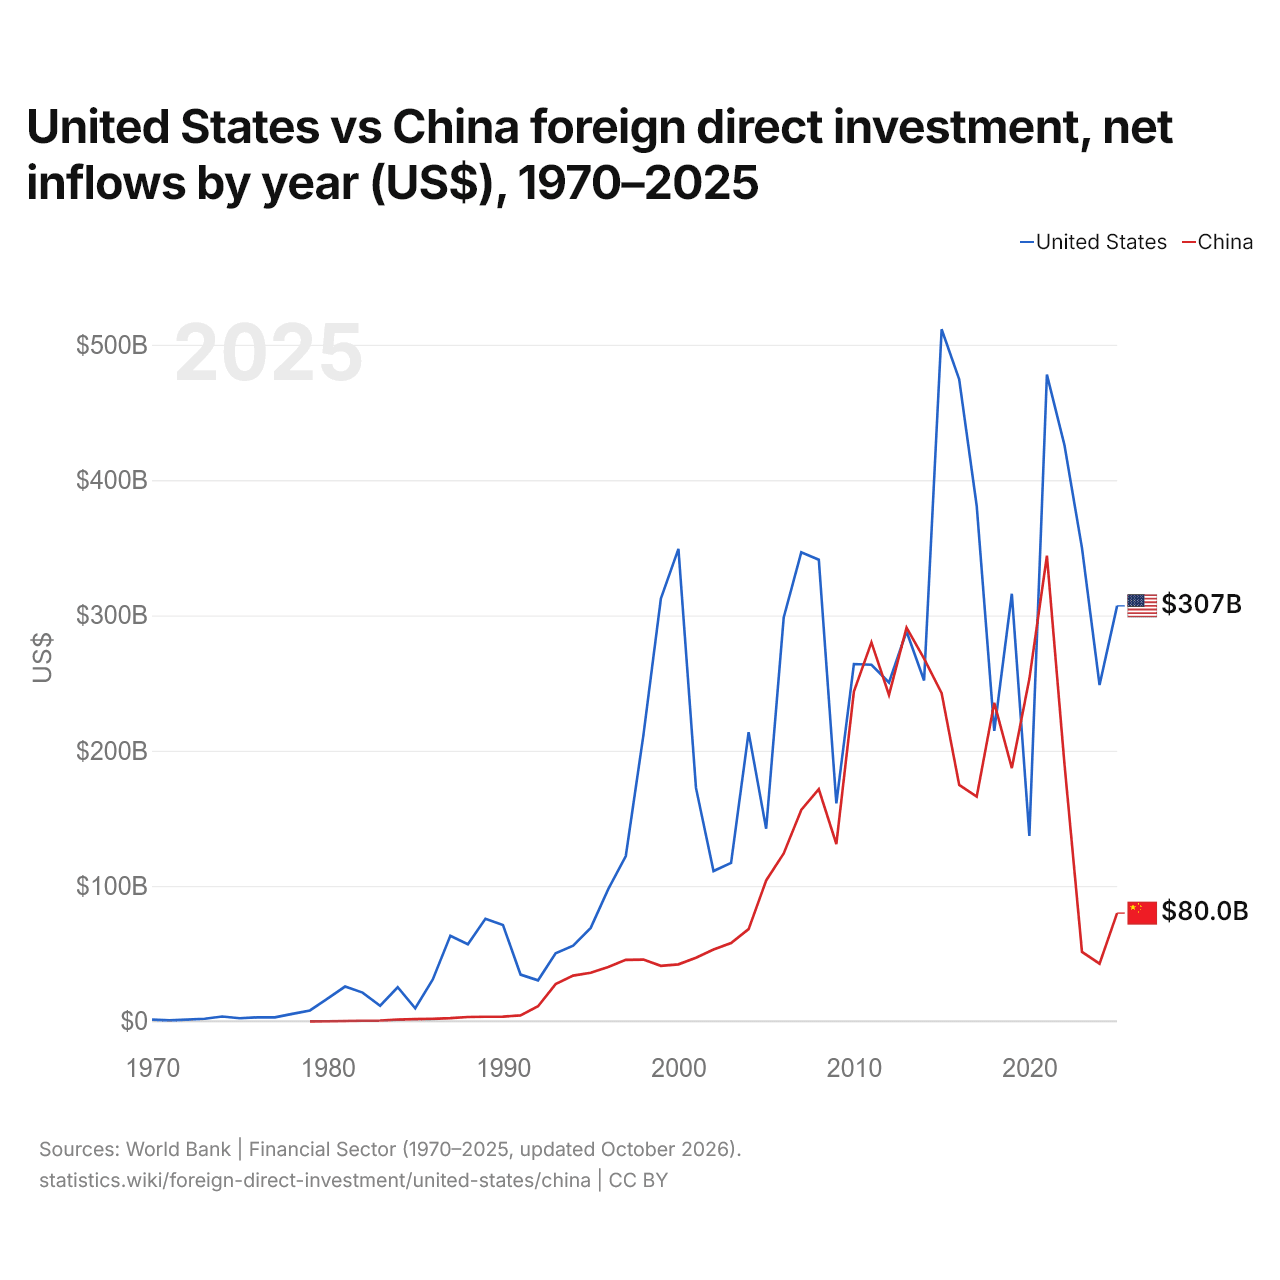
États-Unis vs Chine : investissements directs étrangers, entrées nettes par année ($ US), 1970–2025
| Année | $ US | |
|---|---|---|
 États-Unis |
 Chine |
|
| 2025 | 307 018 000 000 $ US | 79 979 865 650 $ US |
| 2024 | 248 584 000 000 $ US | 42 646 542 015 $ US |
| 2023 | 349 697 000 000 $ US | 51 338 076 802 $ US |
| 2022 | 425 816 000 000 $ US | 190 203 789 093 $ US |
| 2021 | 477 956 000 000 $ US | 344 074 977 062 $ US |
| 2020 | 137 066 000 000 $ US | 253 095 616 059 $ US |
| 2019 | 315 984 000 000 $ US | 187 169 822 365 $ US |
| 2018 | 214 715 000 000 $ US | 235 365 050 036 $ US |
| 2017 | 380 823 000 000 $ US | 166 083 755 722 $ US |
| 2016 | 474 388 000 000 $ US | 174 749 584 584 $ US |
| 2015 | 511 434 000 000 $ US | 242 489 331 627 $ US |
| 2014 | 251 856 000 000 $ US | 268 097 181 064 $ US |
| 2013 | 288 131 000 000 $ US | 290 928 431 467 $ US |
| 2012 | 250 345 000 000 $ US | 241 213 868 161 $ US |
| 2011 | 263 497 000 000 $ US | 280 072 219 150 $ US |
| 2010 | 264 039 000 000 $ US | 243 703 434 558 $ US |
| 2009 | 161 083 000 000 $ US | 131 057 052 870 $ US |
| 2008 | 341 092 000 000 $ US | 171 534 650 312 $ US |
| 2007 | 346 613 000 000 $ US | 156 249 335 203 $ US |
| 2006 | 298 463 000 000 $ US | 124 082 035 619 $ US |
| 2005 | 142 344 000 000 $ US | 104 108 693 867 $ US |
| 2004 | 213 641 000 000 $ US | 68 117 272 181 $ US |
| 2003 | 117 106 000 000 $ US | 57 900 937 467 $ US |
| 2002 | 111 055 000 000 $ US | 53 073 618 897 $ US |
| 2001 | 172 496 000 000 $ US | 47 053 000 000 $ US |
| 2000 | 349 125 000 000 $ US | 42 095 300 000 $ US |
| 1999 | 312 449 000 000 $ US | 41 014 000 000 $ US |
| 1998 | 211 150 000 000 $ US | 45 644 000 000 $ US |
| 1997 | 122 150 000 000 $ US | 45 439 000 000 $ US |
| 1996 | 97 660 000 000 $ US | 40 180 000 000 $ US |
| 1995 | 69 080 000 000 $ US | 35 849 200 000 $ US |
| 1994 | 55 940 000 000 $ US | 33 787 000 000 $ US |
| 1993 | 50 230 000 000 $ US | 27 515 000 000 $ US |
| 1992 | 30 310 000 000 $ US | 11 156 000 000 $ US |
| 1991 | 34 550 000 000 $ US | 4 366 000 000 $ US |
| 1990 | 71 230 000 000 $ US | 3 487 000 000 $ US |
| 1989 | 75 780 000 000 $ US | 3 393 000 000 $ US |
| 1988 | 56 910 000 000 $ US | 3 194 000 000 $ US |
| 1987 | 63 235 000 000 $ US | 2 314 000 000 $ US |
| 1986 | 30 946 000 000 $ US | 1 875 000 000 $ US |
| 1985 | 9 630 000 000 $ US | 1 659 000 000 $ US |
| 1984 | 25 230 000 000 $ US | 1 258 000 000 $ US |
| 1983 | 11 500 000 000 $ US | 636 000 000 $ US |
| 1982 | 21 230 000 000 $ US | 430 000 000 $ US |
| 1981 | 25 680 000 000 $ US | 265 000 000 $ US |
| 1980 | 16 740 000 000 $ US | 57 000 000 $ US |
| 1979 | 8 050 000 000 $ US | 80 000 $ US |
| 1978 | 5 500 000 000 $ US | - |
| 1977 | 2 920 000 000 $ US | - |
| 1976 | 2 910 000 000 $ US | - |
| 1975 | 2 310 000 000 $ US | - |
| 1974 | 3 540 000 000 $ US | - |
| 1973 | 1 930 000 000 $ US | - |
| 1972 | 1 270 000 000 $ US | - |
| 1971 | 770 000 000 $ US | - |
| 1970 | 1 220 000 000 $ US | - |
En 2025, les entrées nettes d'investissements directs étrangers étaient de 307 milliards de dollars aux États-Unis et de 80 milliards de dollars en Chine : 3,8 fois plus aux États-Unis. En 1979, elles étaient de 8,05 milliards de dollars aux États-Unis et de 80 000 dollars en Chine.
Les entrées nettes d'investissements directs étrangers aux États-Unis ont été supérieures à celles de la Chine pendant 42 des 47 années de 1979 à 2025, et inférieures pendant 5.
États-Unis vs Chine : dernières entrées et sorties d'investissements étrangers
|
États-Unis
|
Chine
|
|
|---|---|---|
| Entrées nettes | +307 Md $US | +80,0 Md $US |
| Entrées nettes, % du PIB | +1,0 % | +0,4 % |
| Sorties nettes | +390 Md $US | +157 Md $US |
| Entrées nettes, total 2016–2025 | +3,33 Bn $US | +1,72 Bn $US |
| Rang mondial | 1/192 | 4/192 |
Comparer les investissements directs étrangers de 2 pays au choix
Sources :
- Banque mondiale | Secteur financier (1970–2025, mis à jour en octobre 2026)
Creative Commons Attribution (CC BY) : vous pouvez copier, partager, adapter et réutiliser ce contenu, y compris à des fins commerciales, à condition de citer statistics.wiki et d’indiquer les modifications apportées. Les sources citées ci-dessus peuvent avoir leurs propres conditions de licence.