
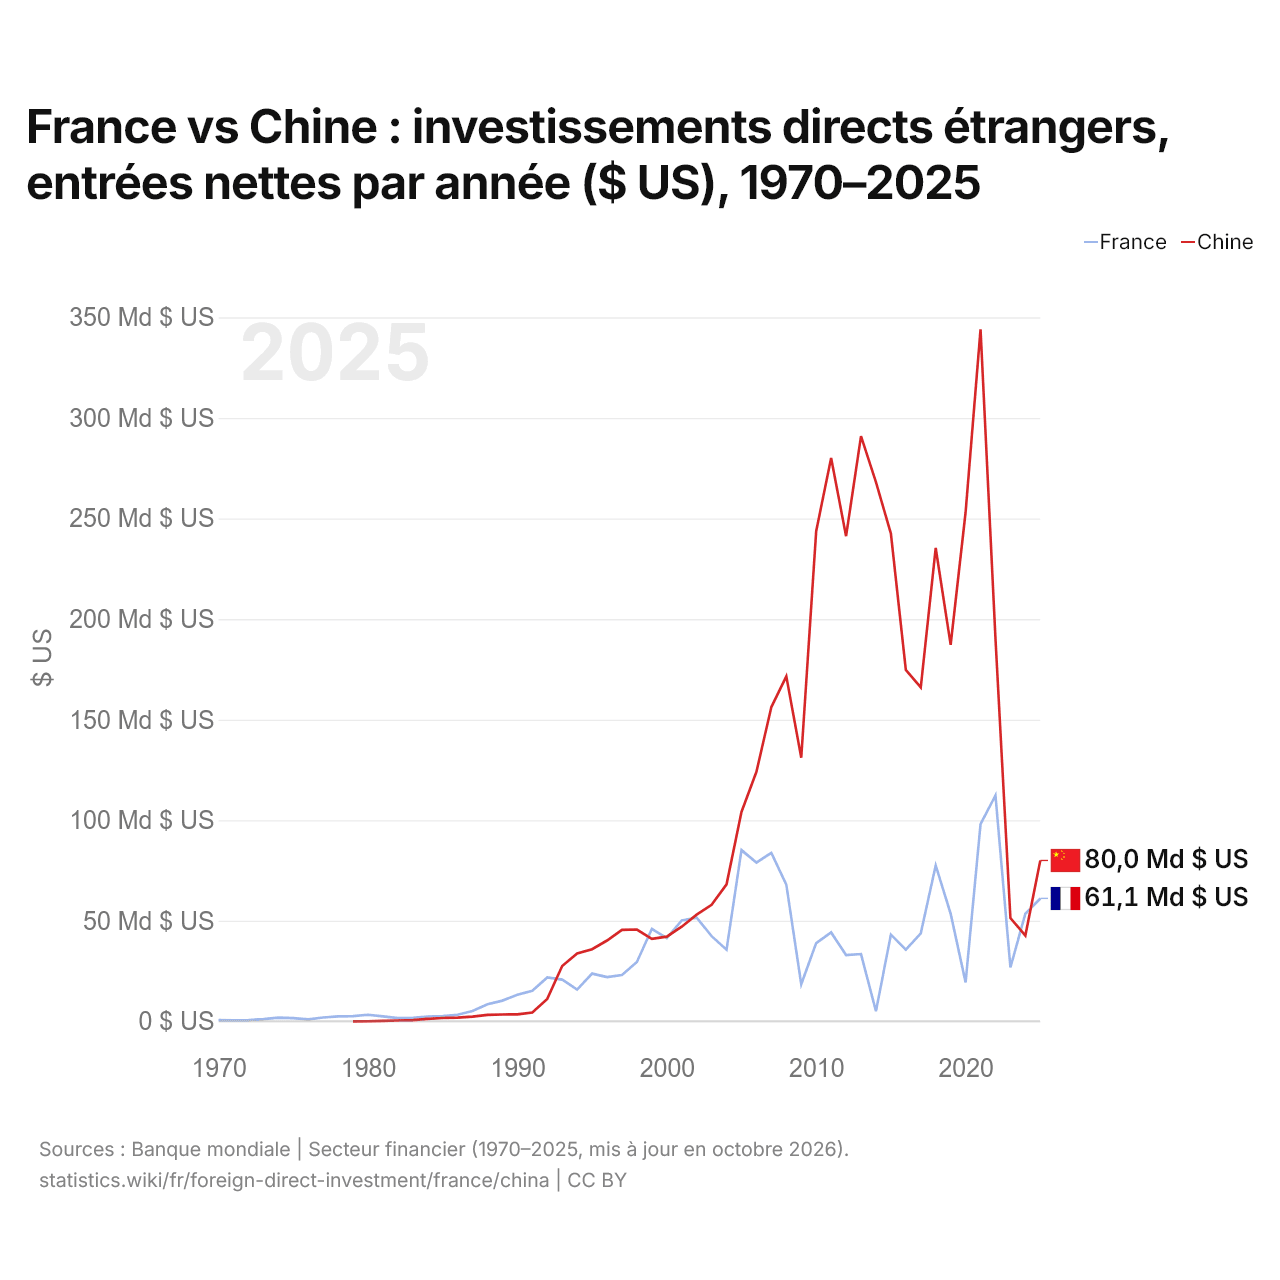
France vs Chine : investissements directs étrangers, entrées nettes par année ($ US), 1970–2025
| Année | $ US | |
|---|---|---|
 France |
 Chine |
|
| 2025 | 61 095 170 373 $ US | 79 979 865 650 $ US |
| 2024 | 53 513 083 339 $ US | 42 646 542 015 $ US |
| 2023 | 26 786 976 937 $ US | 51 338 076 802 $ US |
| 2022 | 112 295 479 270 $ US | 190 203 789 093 $ US |
| 2021 | 98 012 545 019 $ US | 344 074 977 062 $ US |
| 2020 | 19 368 829 836 $ US | 253 095 616 059 $ US |
| 2019 | 53 499 337 504 $ US | 187 169 822 365 $ US |
| 2018 | 77 493 098 693 $ US | 235 365 050 036 $ US |
| 2017 | 43 733 253 504 $ US | 166 083 755 722 $ US |
| 2016 | 35 623 357 280 $ US | 174 749 584 584 $ US |
| 2015 | 43 133 325 471 $ US | 242 489 331 627 $ US |
| 2014 | 5 063 648 998 $ US | 268 097 181 064 $ US |
| 2013 | 33 461 592 994 $ US | 290 928 431 467 $ US |
| 2012 | 32 944 663 318 $ US | 241 213 868 161 $ US |
| 2011 | 44 205 811 127 $ US | 280 072 219 150 $ US |
| 2010 | 38 889 439 213 $ US | 243 703 434 558 $ US |
| 2009 | 18 422 928 062 $ US | 131 057 052 870 $ US |
| 2008 | 67 997 446 905 $ US | 171 534 650 312 $ US |
| 2007 | 83 777 598 395 $ US | 156 249 335 203 $ US |
| 2006 | 78 957 053 786 $ US | 124 082 035 619 $ US |
| 2005 | 85 137 061 931 $ US | 104 108 693 867 $ US |
| 2004 | 35 608 535 813 $ US | 68 117 272 181 $ US |
| 2003 | 42 350 800 678 $ US | 57 900 937 467 $ US |
| 2002 | 51 550 483 854 $ US | 53 073 618 897 $ US |
| 2001 | 50 142 053 919 $ US | 47 053 000 000 $ US |
| 2000 | 41 389 082 665 $ US | 42 095 300 000 $ US |
| 1999 | 45 971 216 472 $ US | 41 014 000 000 $ US |
| 1998 | 29 518 429 032 $ US | 45 644 000 000 $ US |
| 1997 | 23 047 924 755 $ US | 45 439 000 000 $ US |
| 1996 | 21 971 888 803 $ US | 40 180 000 000 $ US |
| 1995 | 23 736 300 874 $ US | 35 849 200 000 $ US |
| 1994 | 15 797 125 295 $ US | 33 787 000 000 $ US |
| 1993 | 20 754 044 036 $ US | 27 515 000 000 $ US |
| 1992 | 21 839 501 253 $ US | 11 156 000 000 $ US |
| 1991 | 15 152 742 090 $ US | 4 366 000 000 $ US |
| 1990 | 13 183 285 335 $ US | 3 487 000 000 $ US |
| 1989 | 10 303 924 629 $ US | 3 393 000 000 $ US |
| 1988 | 8 489 906 284 $ US | 3 194 000 000 $ US |
| 1987 | 5 139 716 802 $ US | 2 314 000 000 $ US |
| 1986 | 3 255 870 956 $ US | 1 875 000 000 $ US |
| 1985 | 2 595 492 780 $ US | 1 659 000 000 $ US |
| 1984 | 2 397 989 219 $ US | 1 258 000 000 $ US |
| 1983 | 1 725 670 869 $ US | 636 000 000 $ US |
| 1982 | 1 585 298 782 $ US | 430 000 000 $ US |
| 1981 | 2 469 631 625 $ US | 265 000 000 $ US |
| 1980 | 3 282 773 278 $ US | 57 000 000 $ US |
| 1979 | 2 588 309 413 $ US | 80 000 $ US |
| 1978 | 2 471 468 400 $ US | - |
| 1977 | 1 896 159 372 $ US | - |
| 1976 | 977 422 844 $ US | - |
| 1975 | 1 563 849 883 $ US | - |
| 1974 | 1 846 644 388 $ US | - |
| 1973 | 1 125 479 247 $ US | - |
| 1972 | 656 666 981 $ US | - |
| 1971 | 525 655 900 $ US | - |
| 1970 | 621 212 782 $ US | - |
En 2025, les entrées nettes d'investissements directs étrangers étaient de 61,1 milliards de dollars en France et de 80 milliards de dollars en Chine : 31 % de plus en Chine. En 1979, elles étaient de 2,59 milliards de dollars en France et de 80 000 dollars en Chine.
Les entrées nettes d'investissements directs étrangers en France ont été supérieures à celles de la Chine pendant 17 des 47 années de 1979 à 2025, et inférieures pendant 30.
France vs Chine : dernières entrées et sorties d'investissements étrangers
|
France
|
Chine
|
|
|---|---|---|
| Entrées nettes | +61,1 Md $US | +80,0 Md $US |
| Entrées nettes, % du PIB | +1,8 % | +0,4 % |
| Sorties nettes | +96,7 Md $US | +157 Md $US |
| Entrées nettes, total 2016–2025 | +581 Md $US | +1,72 Bn $US |
| Rang mondial | 8/192 | 4/192 |
Comparer les investissements directs étrangers de 2 pays au choix
Sources :
- Banque mondiale | Secteur financier (1970–2025, mis à jour en octobre 2026)
Creative Commons Attribution (CC BY) : vous pouvez copier, partager, adapter et réutiliser ce contenu, y compris à des fins commerciales, à condition de citer statistics.wiki et d’indiquer les modifications apportées. Les sources citées ci-dessus peuvent avoir leurs propres conditions de licence.