
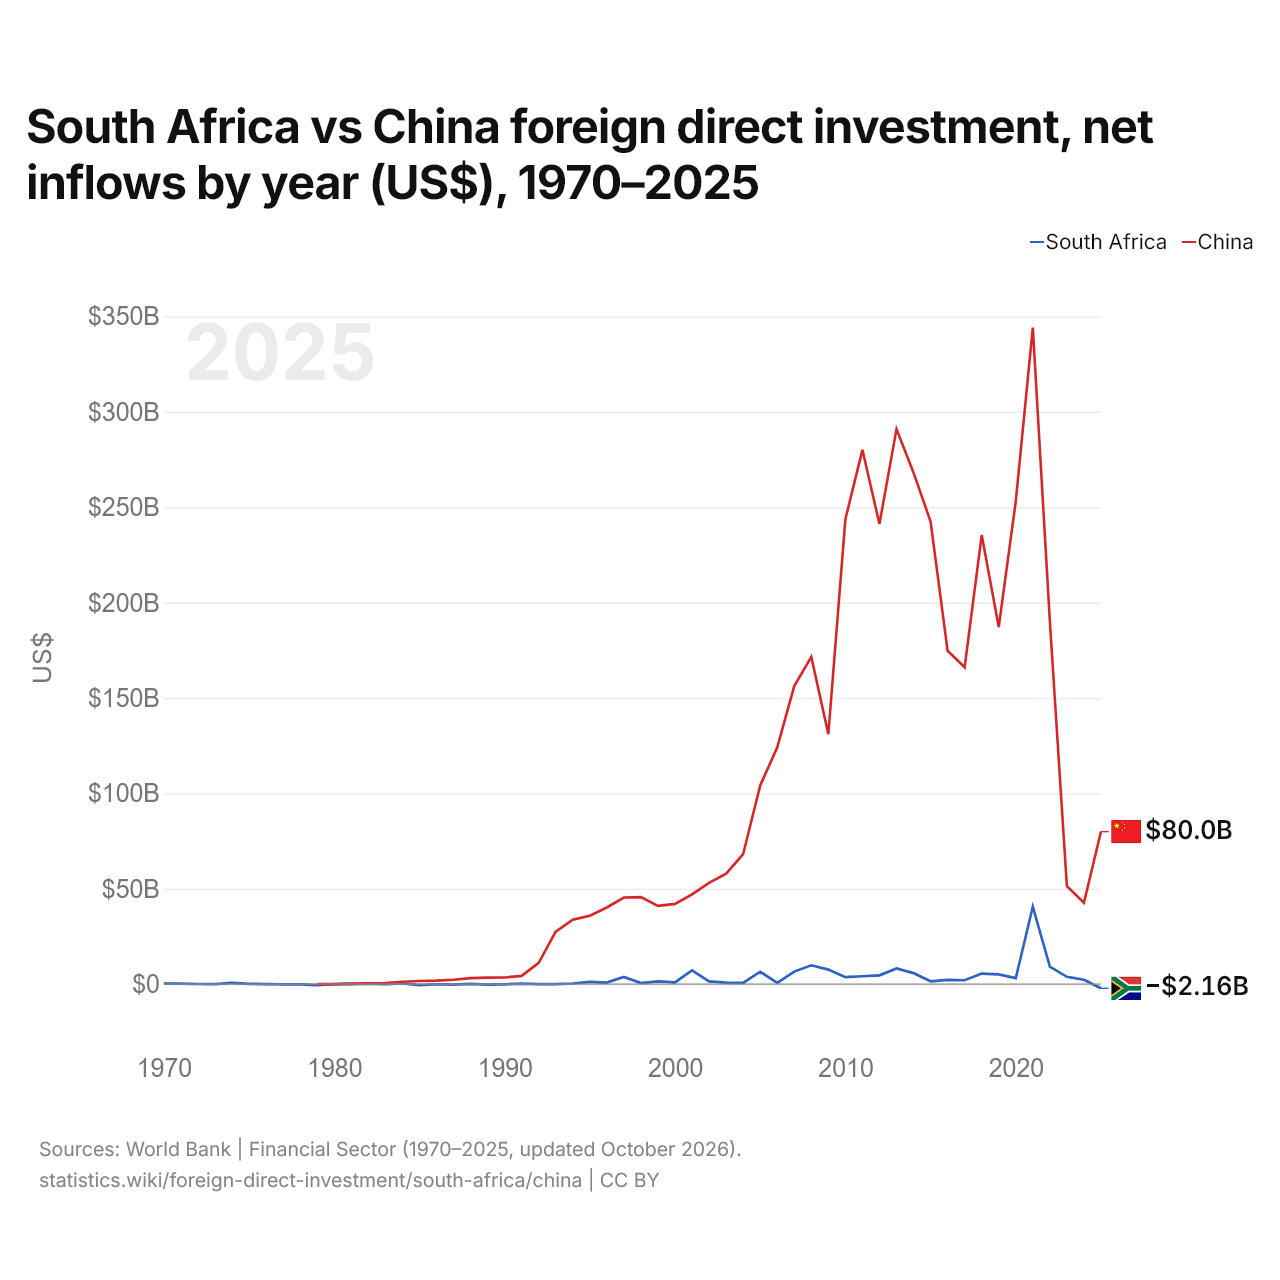
Afrique du Sud vs Chine : investissements directs étrangers, entrées nettes par année ($ US), 1970–2025
| Année | $ US | |
|---|---|---|
 Afrique du Sud |
 Chine |
|
| 2025 | −2 160 797 070 $ US | 79 979 865 650 $ US |
| 2024 | 2 330 218 039 $ US | 42 646 542 015 $ US |
| 2023 | 3 862 994 370 $ US | 51 338 076 802 $ US |
| 2022 | 9 238 990 828 $ US | 190 203 789 093 $ US |
| 2021 | 40 658 789 145 $ US | 344 074 977 062 $ US |
| 2020 | 3 153 552 569 $ US | 253 095 616 059 $ US |
| 2019 | 5 116 098 443 $ US | 187 169 822 365 $ US |
| 2018 | 5 569 462 350 $ US | 235 365 050 036 $ US |
| 2017 | 2 058 579 911 $ US | 166 083 755 722 $ US |
| 2016 | 2 215 307 020 $ US | 174 749 584 584 $ US |
| 2015 | 1 521 139 945 $ US | 242 489 331 627 $ US |
| 2014 | 5 791 659 020 $ US | 268 097 181 064 $ US |
| 2013 | 8 232 518 816 $ US | 290 928 431 467 $ US |
| 2012 | 4 626 029 122 $ US | 241 213 868 161 $ US |
| 2011 | 4 139 289 123 $ US | 280 072 219 150 $ US |
| 2010 | 3 693 271 715 $ US | 243 703 434 558 $ US |
| 2009 | 7 624 489 974 $ US | 131 057 052 870 $ US |
| 2008 | 9 885 001 293 $ US | 171 534 650 312 $ US |
| 2007 | 6 586 792 253 $ US | 156 249 335 203 $ US |
| 2006 | 623 291 744 $ US | 124 082 035 619 $ US |
| 2005 | 6 522 098 178 $ US | 104 108 693 867 $ US |
| 2004 | 701 422 008 $ US | 68 117 272 181 $ US |
| 2003 | 783 136 092 $ US | 57 900 937 467 $ US |
| 2002 | 1 479 804 589 $ US | 53 073 618 897 $ US |
| 2001 | 7 270 344 986 $ US | 47 053 000 000 $ US |
| 2000 | 968 831 356 $ US | 42 095 300 000 $ US |
| 1999 | 1 503 332 454 $ US | 41 014 000 000 $ US |
| 1998 | 550 338 596 $ US | 45 644 000 000 $ US |
| 1997 | 3 810 543 923 $ US | 45 439 000 000 $ US |
| 1996 | 816 389 274 $ US | 40 180 000 000 $ US |
| 1995 | 1 248 424 933 $ US | 35 849 200 000 $ US |
| 1994 | 374 410 441 $ US | 33 787 000 000 $ US |
| 1993 | 11 290 546 $ US | 27 515 000 000 $ US |
| 1992 | 3 358 018 $ US | 11 156 000 000 $ US |
| 1991 | 254 133 622 $ US | 4 366 000 000 $ US |
| 1990 | −75 722 412 $ US | 3 487 000 000 $ US |
| 1989 | −201 208 431 $ US | 3 393 000 000 $ US |
| 1988 | 158 437 159 $ US | 3 194 000 000 $ US |
| 1987 | −191 667 970 $ US | 2 314 000 000 $ US |
| 1986 | −50 487 074 $ US | 1 875 000 000 $ US |
| 1985 | −452 643 658 $ US | 1 659 000 000 $ US |
| 1984 | 419 500 000 $ US | 1 258 000 000 $ US |
| 1983 | 70 900 000 $ US | 636 000 000 $ US |
| 1982 | 329 700 000 $ US | 430 000 000 $ US |
| 1981 | 65 000 000 $ US | 265 000 000 $ US |
| 1980 | −10 300 000 $ US | 57 000 000 $ US |
| 1979 | −484 547 334 $ US | 80 000 $ US |
| 1978 | −109 250 027 $ US | - |
| 1977 | −121 900 030 $ US | - |
| 1976 | 18 400 005 $ US | - |
| 1975 | 187 962 808 $ US | - |
| 1974 | 696 123 636 $ US | - |
| 1973 | 27 379 139 $ US | - |
| 1972 | 114 478 246 $ US | - |
| 1971 | 260 060 933 $ US | - |
| 1970 | 334 599 866 $ US | - |
En 2025, les entrées nettes d'investissements directs étrangers étaient négatives en Afrique du Sud, 2,16 milliards de dollars et de 80 milliards de dollars en Chine. En 1979, elles étaient négatives en Afrique du Sud, 485 millions de dollars et de 80 000 dollars en Chine.
Les entrées nettes d'investissements directs étrangers en Afrique du Sud ont été inférieures à celles de la Chine chacune des 47 années de 1979 à 2025.
Afrique du Sud vs Chine : dernières entrées et sorties d'investissements étrangers
|
Afrique du Sud
|
Chine
|
|
|---|---|---|
| Entrées nettes | −2,16 Md $US | +80,0 Md $US |
| Entrées nettes, % du PIB | −0,5 % | +0,4 % |
| Sorties nettes | −4,01 Md $US | +157 Md $US |
| Entrées nettes, total 2016–2025 | +72,0 Md $US | +1,72 Bn $US |
| Rang mondial | 186/192 | 4/192 |
Comparer les investissements directs étrangers de 2 pays au choix
Sources :
- Banque mondiale | Secteur financier (1970–2025, mis à jour en octobre 2026)
Creative Commons Attribution (CC BY) : vous pouvez copier, partager, adapter et réutiliser ce contenu, y compris à des fins commerciales, à condition de citer statistics.wiki et d’indiquer les modifications apportées. Les sources citées ci-dessus peuvent avoir leurs propres conditions de licence.