
Guyana vs France : investissements directs étrangers, entrées nettes par année ($ US), 1970–2025
| Année | $ US | |
|---|---|---|
 Guyana |
 France |
|
| 2025 | 8 968 224 708 $ US | 61 095 170 373 $ US |
| 2024 | 8 629 500 000 $ US | 53 513 083 339 $ US |
| 2023 | −1 135 036 126 $ US | 26 786 976 937 $ US |
| 2022 | −2 996 952 015 $ US | 112 295 479 270 $ US |
| 2021 | 2 236 503 735 $ US | 98 012 545 019 $ US |
| 2020 | 1 283 062 521 $ US | 19 368 829 836 $ US |
| 2019 | 2 690 327 776 $ US | 53 499 337 504 $ US |
| 2018 | 1 231 760 000 $ US | 77 493 098 693 $ US |
| 2017 | 212 241 105 $ US | 43 733 253 504 $ US |
| 2016 | 58 000 000 $ US | 35 623 357 280 $ US |
| 2015 | 137 700 000 $ US | 43 133 325 471 $ US |
| 2014 | 237 750 049 $ US | 5 063 648 998 $ US |
| 2013 | 200 558 390 $ US | 33 461 592 994 $ US |
| 2012 | 277 910 000 $ US | 32 944 663 318 $ US |
| 2011 | 246 800 000 $ US | 44 205 811 127 $ US |
| 2010 | 198 000 000 $ US | 38 889 439 213 $ US |
| 2009 | 164 000 000 $ US | 18 422 928 062 $ US |
| 2008 | 178 000 000 $ US | 67 997 446 905 $ US |
| 2007 | 152 400 000 $ US | 83 777 598 395 $ US |
| 2006 | 102 400 000 $ US | 78 957 053 786 $ US |
| 2005 | 76 800 000 $ US | 85 137 061 931 $ US |
| 2004 | 30 000 000 $ US | 35 608 535 813 $ US |
| 2003 | 26 100 000 $ US | 42 350 800 678 $ US |
| 2002 | 43 600 000 $ US | 51 550 483 854 $ US |
| 2001 | 56 000 000 $ US | 50 142 053 919 $ US |
| 2000 | 67 100 000 $ US | 41 389 082 665 $ US |
| 1999 | 46 000 000 $ US | 45 971 216 472 $ US |
| 1998 | 44 000 000 $ US | 29 518 429 032 $ US |
| 1997 | 52 000 000 $ US | 23 047 924 755 $ US |
| 1996 | 59 000 000 $ US | 21 971 888 803 $ US |
| 1995 | 74 420 000 $ US | 23 736 300 874 $ US |
| 1994 | 106 690 000 $ US | 15 797 125 295 $ US |
| 1993 | 69 540 000 $ US | 20 754 044 036 $ US |
| 1992 | 146 610 000 $ US | 21 839 501 253 $ US |
| 1991 | 12 340 000 $ US | 15 152 742 090 $ US |
| 1990 | 7 900 000 $ US | 13 183 285 335 $ US |
| 1989 | −2 060 000 $ US | 10 303 924 629 $ US |
| 1988 | 2 100 000 $ US | 8 489 906 284 $ US |
| 1987 | 4 350 000 $ US | 5 139 716 802 $ US |
| 1986 | −9 000 000 $ US | 3 255 870 956 $ US |
| 1985 | 1 810 974 $ US | 2 595 492 780 $ US |
| 1984 | 4 489 020 $ US | 2 397 989 219 $ US |
| 1983 | 4 733 333 $ US | 1 725 670 869 $ US |
| 1982 | 4 433 333 $ US | 1 585 298 782 $ US |
| 1981 | −1 777 778 $ US | 2 469 631 625 $ US |
| 1980 | 588 235 $ US | 3 282 773 278 $ US |
| 1979 | 588 235 $ US | 2 588 309 413 $ US |
| 1978 | 4 020 000 $ US | 2 471 468 400 $ US |
| 1977 | −1 764 706 $ US | 1 896 159 372 $ US |
| 1976 | 5 010 000 $ US | 977 422 844 $ US |
| 1975 | 800 000 $ US | 1 563 849 883 $ US |
| 1974 | 1 360 000 $ US | 1 846 644 388 $ US |
| 1973 | 8 200 000 $ US | 1 125 479 247 $ US |
| 1972 | 2 500 000 $ US | 656 666 981 $ US |
| 1971 | −2 440 000 $ US | 525 655 900 $ US |
| 1970 | 9 000 000 $ US | 621 212 782 $ US |
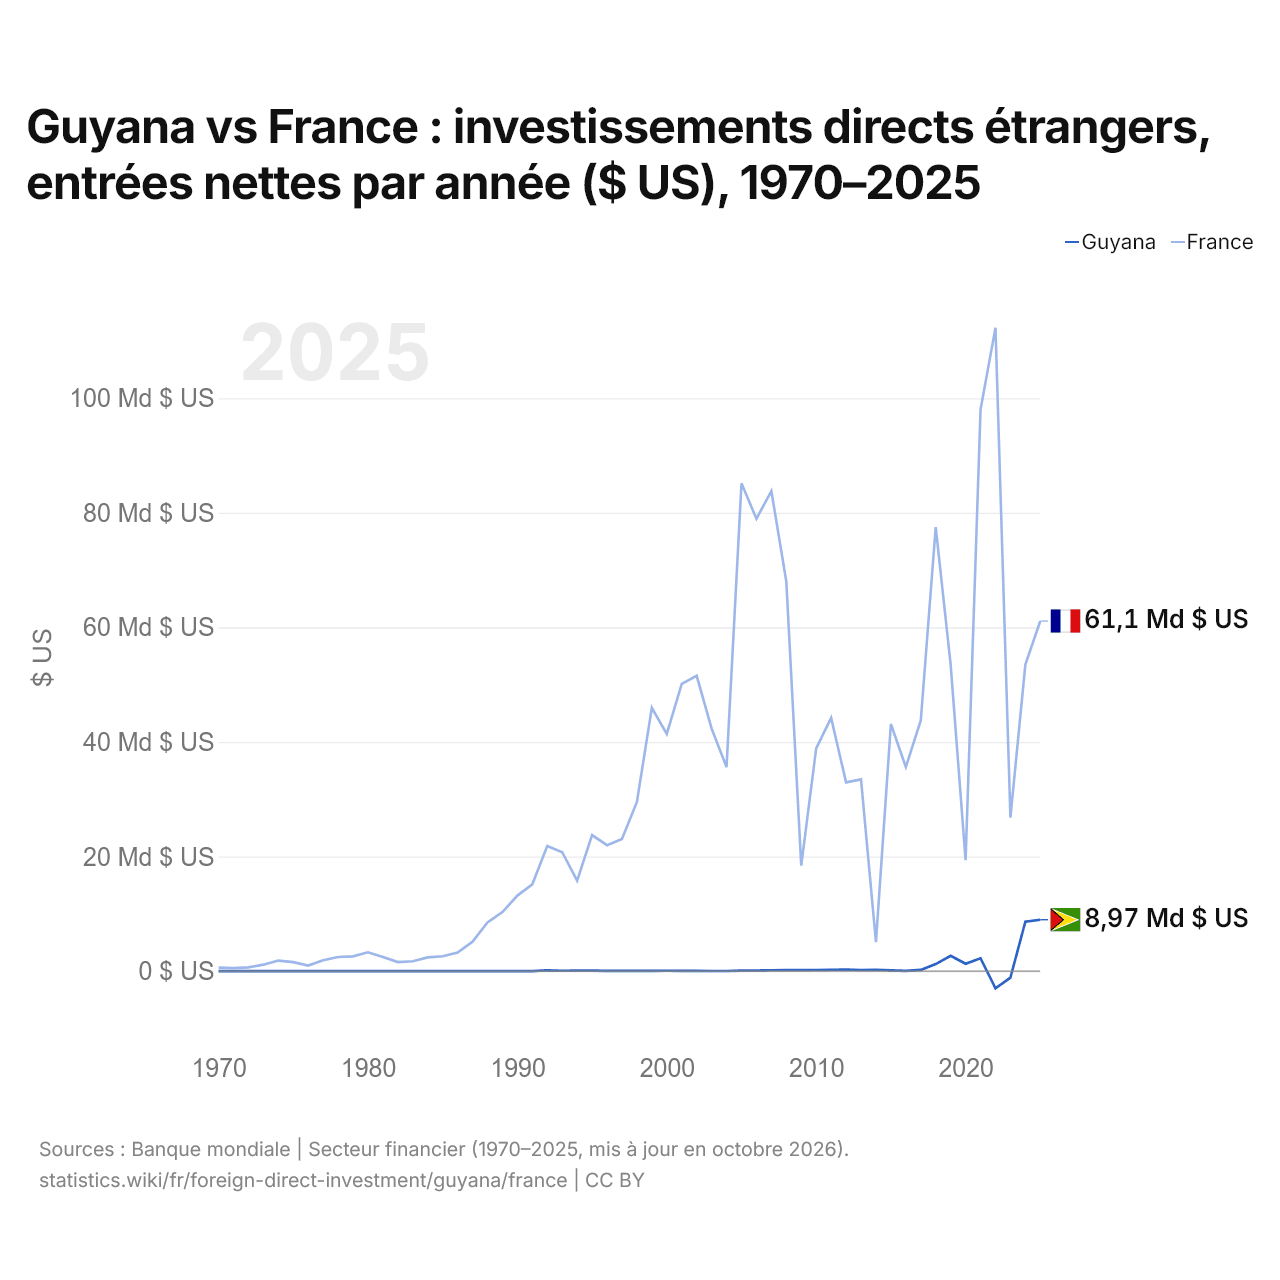
En 2025, les entrées nettes d'investissements directs étrangers étaient de 8,97 milliards de dollars au Guyana et de 61,1 milliards de dollars en France : 6,8 fois plus en France. En 1970, elles étaient de 9 millions de dollars au Guyana et de 621 millions de dollars en France.
Les entrées nettes d'investissements directs étrangers au Guyana ont été inférieures à celles de la France chacune des 56 années de 1970 à 2025.
Guyana vs France : dernières entrées et sorties d'investissements étrangers
|
Guyana
|
France
|
|
|---|---|---|
| Entrées nettes | +8,97 Md $US | +61,1 Md $US |
| Entrées nettes, % du PIB | +33,1 % | +1,8 % |
| Sorties nettes | +18,0 M $US | +96,7 Md $US |
| Entrées nettes, total 2016–2025 | +21,2 Md $US | +581 Md $US |
| Rang mondial | 39/192 | 8/192 |
Comparer les investissements directs étrangers de 2 pays au choix
Sources :
- Banque mondiale | Secteur financier (1970–2025, mis à jour en octobre 2026)
Creative Commons Attribution (CC BY) : vous pouvez copier, partager, adapter et réutiliser ce contenu, y compris à des fins commerciales, à condition de citer statistics.wiki et d’indiquer les modifications apportées. Les sources citées ci-dessus peuvent avoir leurs propres conditions de licence.