
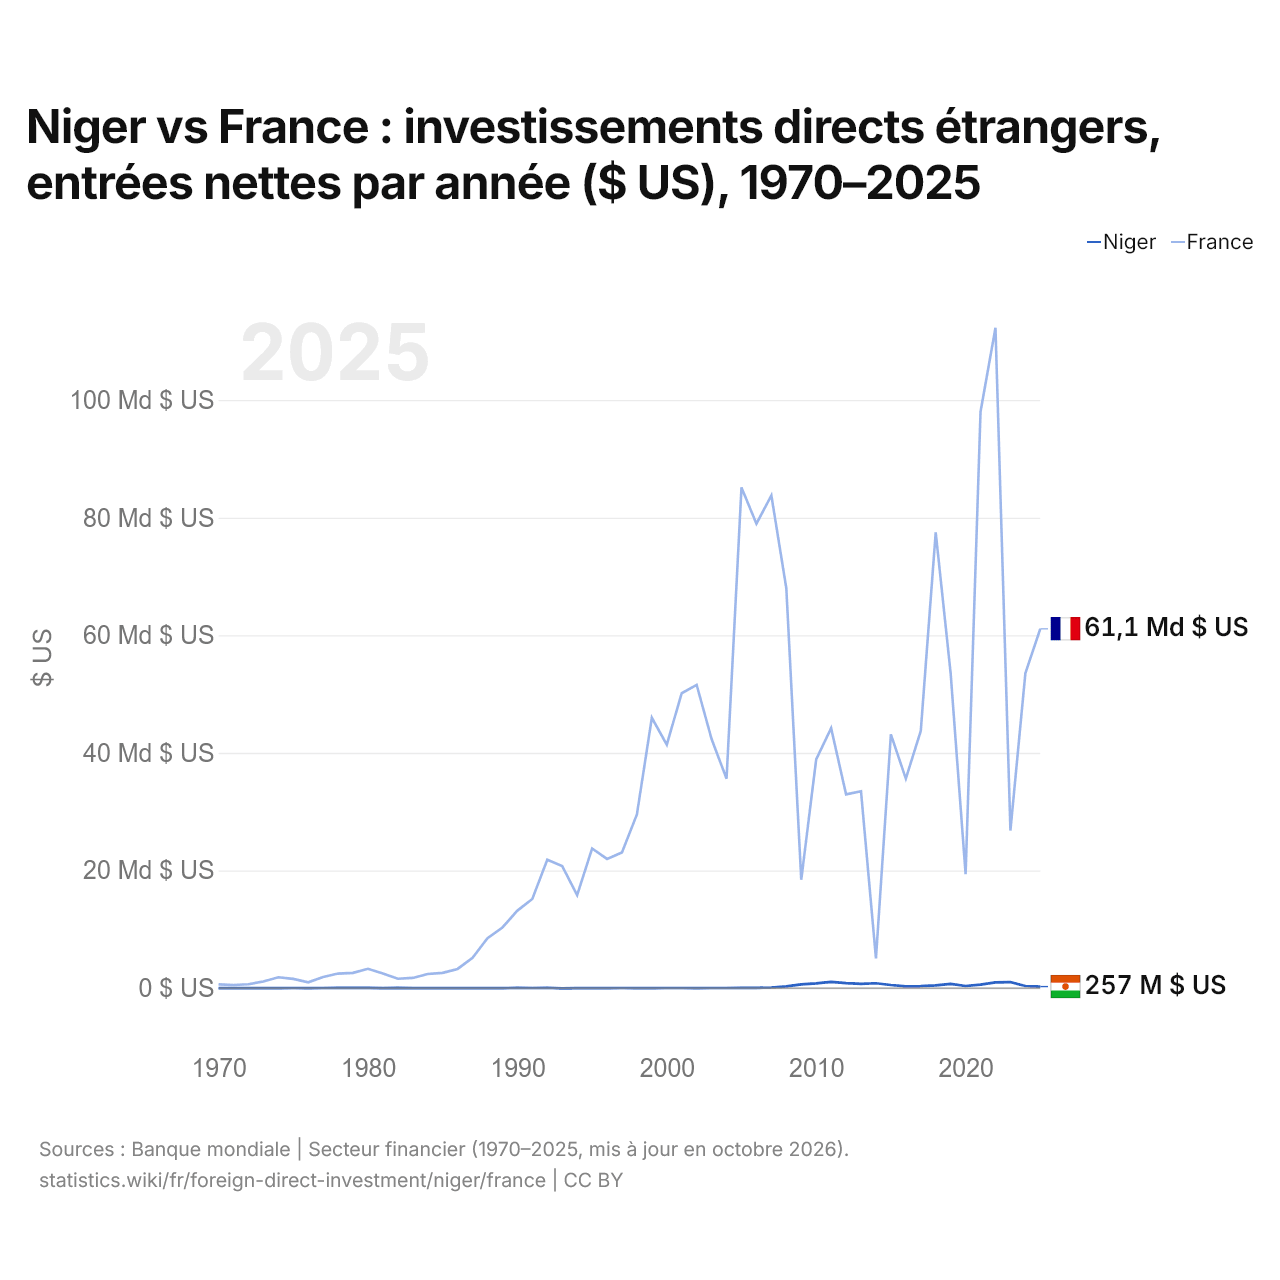
Niger vs France : investissements directs étrangers, entrées nettes par année ($ US), 1970–2025
| Année | $ US | |
|---|---|---|
 Niger |
 France |
|
| 2025 | 257 053 405 $ US | 61 095 170 373 $ US |
| 2024 | 358 083 456 $ US | 53 513 083 339 $ US |
| 2023 | 1 025 552 444 $ US | 26 786 976 937 $ US |
| 2022 | 965 975 261 $ US | 112 295 479 270 $ US |
| 2021 | 594 829 132 $ US | 98 012 545 019 $ US |
| 2020 | 360 653 575 $ US | 19 368 829 836 $ US |
| 2019 | 717 147 639 $ US | 53 499 337 504 $ US |
| 2018 | 466 042 273 $ US | 77 493 098 693 $ US |
| 2017 | 338 710 710 $ US | 43 733 253 504 $ US |
| 2016 | 301 332 481 $ US | 35 623 357 280 $ US |
| 2015 | 529 476 871 $ US | 43 133 325 471 $ US |
| 2014 | 822 967 023 $ US | 5 063 648 998 $ US |
| 2013 | 719 338 470 $ US | 33 461 592 994 $ US |
| 2012 | 841 227 437 $ US | 32 944 663 318 $ US |
| 2011 | 1 067 186 136 $ US | 44 205 811 127 $ US |
| 2010 | 796 636 158 $ US | 38 889 439 213 $ US |
| 2009 | 633 819 197 $ US | 18 422 928 062 $ US |
| 2008 | 283 076 207 $ US | 67 997 446 905 $ US |
| 2007 | 99 073 672 $ US | 83 777 598 395 $ US |
| 2006 | 40 310 044 $ US | 78 957 053 786 $ US |
| 2005 | 49 753 597 $ US | 85 137 061 931 $ US |
| 2004 | 24 411 287 $ US | 35 608 535 813 $ US |
| 2003 | 18 529 139 $ US | 42 350 800 678 $ US |
| 2002 | 7 827 442 $ US | 51 550 483 854 $ US |
| 2001 | 22 587 455 $ US | 50 142 053 919 $ US |
| 2000 | 15 767 212 $ US | 41 389 082 665 $ US |
| 1999 | 1 605 269 $ US | 45 971 216 472 $ US |
| 1998 | −1 764 551 $ US | 29 518 429 032 $ US |
| 1997 | 18 959 364 $ US | 23 047 924 755 $ US |
| 1996 | 8 630 591 $ US | 21 971 888 803 $ US |
| 1995 | 2 233 805 $ US | 23 736 300 874 $ US |
| 1994 | 4 075 974 $ US | 15 797 125 295 $ US |
| 1993 | −34 157 056 $ US | 20 754 044 036 $ US |
| 1992 | 56 390 111 $ US | 21 839 501 253 $ US |
| 1991 | 11 240 420 $ US | 15 152 742 090 $ US |
| 1990 | 40 809 537 $ US | 13 183 285 335 $ US |
| 1989 | −1 564 223 $ US | 10 303 924 629 $ US |
| 1988 | 2 155 460 $ US | 8 489 906 284 $ US |
| 1987 | 6 405 211 $ US | 5 139 716 802 $ US |
| 1986 | −12 408 105 $ US | 3 255 870 956 $ US |
| 1985 | −9 382 033 $ US | 2 595 492 780 $ US |
| 1984 | 1 446 368 $ US | 2 397 989 219 $ US |
| 1983 | 1 215 013 $ US | 1 725 670 869 $ US |
| 1982 | 28 216 140 $ US | 1 585 298 782 $ US |
| 1981 | −6 112 653 $ US | 2 469 631 625 $ US |
| 1980 | 49 119 755 $ US | 3 282 773 278 $ US |
| 1979 | 46 788 845 $ US | 2 588 309 413 $ US |
| 1978 | 42 657 877 $ US | 2 471 468 400 $ US |
| 1977 | 12 850 065 $ US | 1 896 159 372 $ US |
| 1976 | 9 889 078 $ US | 977 422 844 $ US |
| 1975 | 22 555 805 $ US | 1 563 849 883 $ US |
| 1974 | 6 908 881 $ US | 1 846 644 388 $ US |
| 1973 | 1 000 000 $ US | 1 125 479 247 $ US |
| 1972 | 900 000 $ US | 656 666 981 $ US |
| 1971 | −5 300 000 $ US | 525 655 900 $ US |
| 1970 | 2 720 000 $ US | 621 212 782 $ US |
En 2025, les entrées nettes d'investissements directs étrangers étaient de 257 millions de dollars au Niger et de 61,1 milliards de dollars en France : 240 fois plus en France. En 1970, elles étaient de 2,72 millions de dollars au Niger et de 621 millions de dollars en France.
Les entrées nettes d'investissements directs étrangers au Niger ont été inférieures à celles de la France chacune des 56 années de 1970 à 2025.
Niger vs France : dernières entrées et sorties d'investissements étrangers
|
Niger
|
France
|
|
|---|---|---|
| Entrées nettes | +257 M $US | +61,1 Md $US |
| Entrées nettes, % du PIB | +1,2 % | +1,8 % |
| Sorties nettes | +6,51 M $US | +96,7 Md $US |
| Entrées nettes, total 2016–2025 | +5,39 Md $US | +581 Md $US |
| Rang mondial | 133/192 | 8/192 |
Comparer les investissements directs étrangers de 2 pays au choix
Sources :
- Banque mondiale | Secteur financier (1970–2025, mis à jour en octobre 2026)
Creative Commons Attribution (CC BY) : vous pouvez copier, partager, adapter et réutiliser ce contenu, y compris à des fins commerciales, à condition de citer statistics.wiki et d’indiquer les modifications apportées. Les sources citées ci-dessus peuvent avoir leurs propres conditions de licence.