
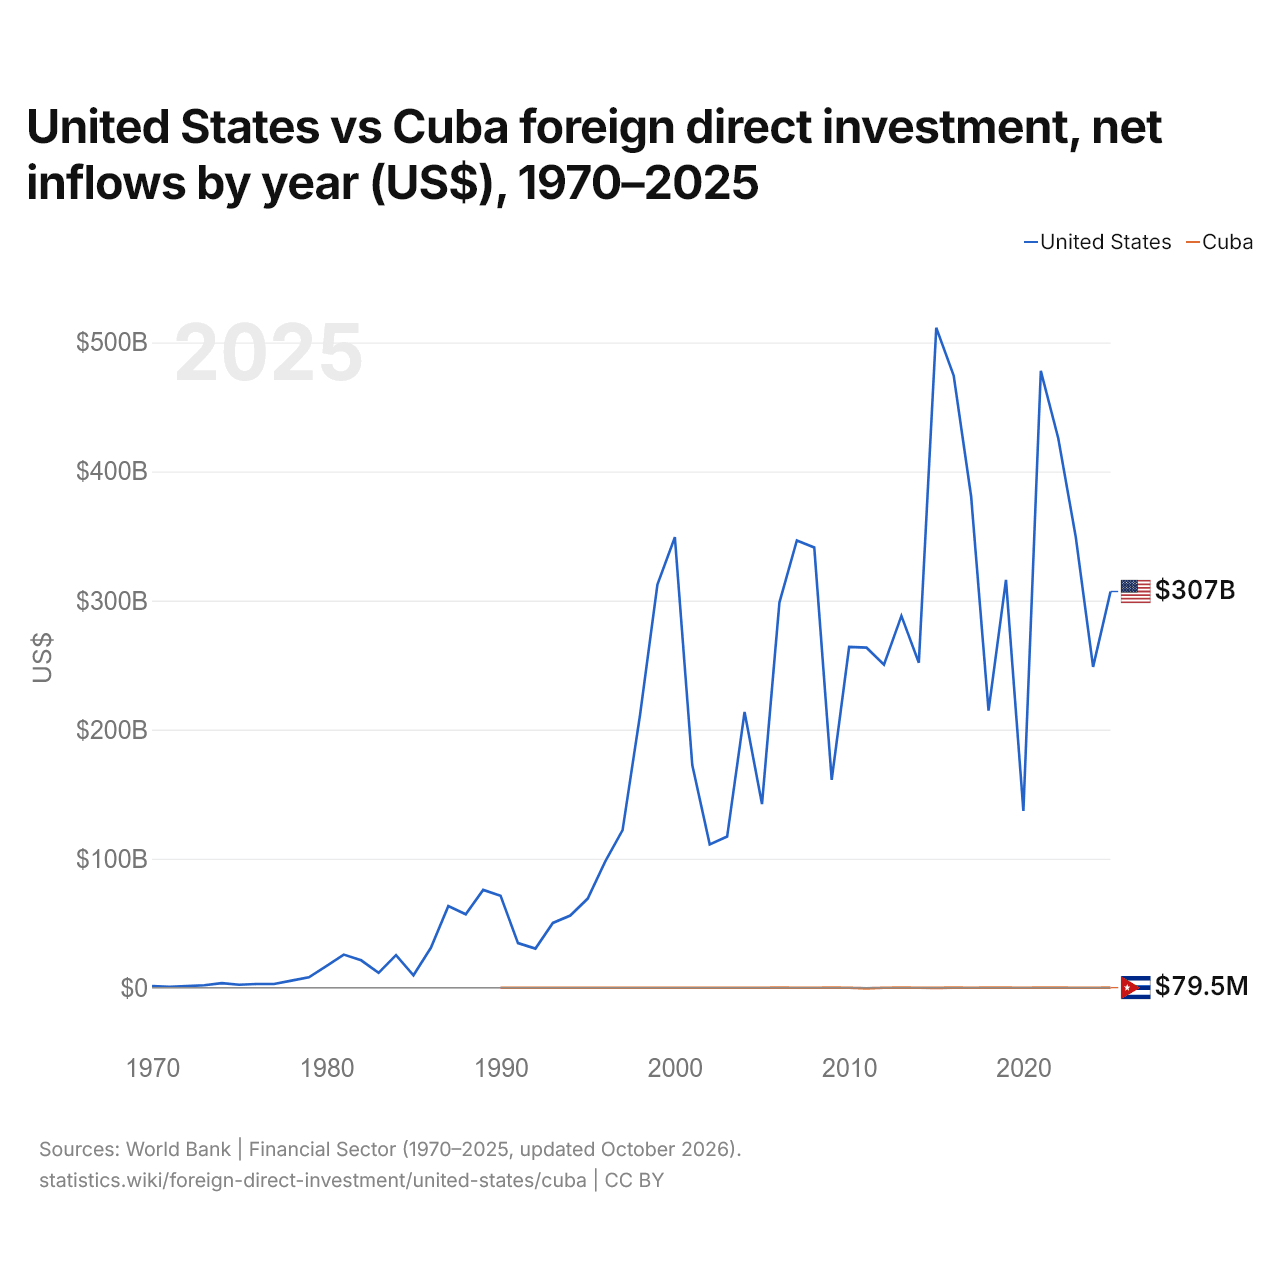
États-Unis vs Cuba : investissements directs étrangers, entrées nettes par année ($ US), 1970–2025
| Année | $ US | |
|---|---|---|
 États-Unis |
 Cuba |
|
| 2025 | 307 018 000 000 $ US | 79 458 741 $ US |
| 2024 | 248 584 000 000 $ US | −7 792 805 $ US |
| 2023 | 349 697 000 000 $ US | −9 876 548 $ US |
| 2022 | 425 816 000 000 $ US | 133 661 344 $ US |
| 2021 | 477 956 000 000 $ US | 165 277 886 $ US |
| 2020 | 137 066 000 000 $ US | 1 615 353 $ US |
| 2019 | 315 984 000 000 $ US | 32 902 371 $ US |
| 2018 | 214 715 000 000 $ US | 95 074 983 $ US |
| 2017 | 380 823 000 000 $ US | 16 422 701 $ US |
| 2016 | 474 388 000 000 $ US | 73 077 117 $ US |
| 2015 | 511 434 000 000 $ US | −122 738 501 $ US |
| 2014 | 251 856 000 000 $ US | −12 115 924 $ US |
| 2013 | 288 131 000 000 $ US | 161 971 687 $ US |
| 2012 | 250 345 000 000 $ US | −32 354 526 $ US |
| 2011 | 263 497 000 000 $ US | −443 724 231 $ US |
| 2010 | 264 039 000 000 $ US | −9 134 731 $ US |
| 2009 | 161 083 000 000 $ US | 43 260 267 $ US |
| 2008 | 341 092 000 000 $ US | 14 309 769 $ US |
| 2007 | 346 613 000 000 $ US | −22 945 158 $ US |
| 2006 | 298 463 000 000 $ US | 33 475 918 $ US |
| 2005 | 142 344 000 000 $ US | 483 533 $ US |
| 2004 | 213 641 000 000 $ US | −1 761 312 $ US |
| 2003 | 117 106 000 000 $ US | 851 038 $ US |
| 2002 | 111 055 000 000 $ US | 449 007 $ US |
| 2001 | 172 496 000 000 $ US | −419 097 $ US |
| 2000 | 349 125 000 000 $ US | 1 042 934 $ US |
| 1999 | 312 449 000 000 $ US | −717 005 $ US |
| 1998 | 211 150 000 000 $ US | 3 041 517 $ US |
| 1997 | 122 150 000 000 $ US | 2 255 606 $ US |
| 1996 | 97 660 000 000 $ US | −1 151 663 $ US |
| 1995 | 69 080 000 000 $ US | 398 812 $ US |
| 1994 | 55 940 000 000 $ US | 14 266 173 $ US |
| 1993 | 50 230 000 000 $ US | 2 711 756 $ US |
| 1992 | 30 310 000 000 $ US | 1 897 386 $ US |
| 1991 | 34 550 000 000 $ US | 10 036 868 $ US |
| 1990 | 71 230 000 000 $ US | 1 031 264 $ US |
| 1989 | 75 780 000 000 $ US | - |
| 1988 | 56 910 000 000 $ US | - |
| 1987 | 63 235 000 000 $ US | - |
| 1986 | 30 946 000 000 $ US | - |
| 1985 | 9 630 000 000 $ US | - |
| 1984 | 25 230 000 000 $ US | - |
| 1983 | 11 500 000 000 $ US | - |
| 1982 | 21 230 000 000 $ US | - |
| 1981 | 25 680 000 000 $ US | - |
| 1980 | 16 740 000 000 $ US | - |
| 1979 | 8 050 000 000 $ US | - |
| 1978 | 5 500 000 000 $ US | - |
| 1977 | 2 920 000 000 $ US | - |
| 1976 | 2 910 000 000 $ US | - |
| 1975 | 2 310 000 000 $ US | - |
| 1974 | 3 540 000 000 $ US | - |
| 1973 | 1 930 000 000 $ US | - |
| 1972 | 1 270 000 000 $ US | - |
| 1971 | 770 000 000 $ US | - |
| 1970 | 1 220 000 000 $ US | - |
En 2025, les entrées nettes d'investissements directs étrangers étaient de 307 milliards de dollars aux États-Unis et de 79,5 millions de dollars à Cuba : 3 900 fois plus aux États-Unis. En 1990, elles étaient de 71,2 milliards de dollars aux États-Unis et de 1,03 million de dollars à Cuba.
Les entrées nettes d'investissements directs étrangers aux États-Unis ont été supérieures à celles de Cuba chacune des 36 années de 1990 à 2025.
États-Unis vs Cuba : dernières entrées et sorties d'investissements étrangers
|
États-Unis
|
Cuba
|
|
|---|---|---|
| Entrées nettes | +307 Md $US | +79,5 M $US |
| Entrées nettes, % du PIB | +1,0 % | n.d. |
| Sorties nettes | +390 Md $US (2025) | n.d. |
| Entrées nettes, total 2016–2025 | +3,33 Bn $US | +580 M $US |
| Rang mondial | 1/192 | 147/192 |
Comparer les investissements directs étrangers de 2 pays au choix
Sources :
- Banque mondiale | Secteur financier (1970–2025, mis à jour en octobre 2026)
Creative Commons Attribution (CC BY) : vous pouvez copier, partager, adapter et réutiliser ce contenu, y compris à des fins commerciales, à condition de citer statistics.wiki et d’indiquer les modifications apportées. Les sources citées ci-dessus peuvent avoir leurs propres conditions de licence.