
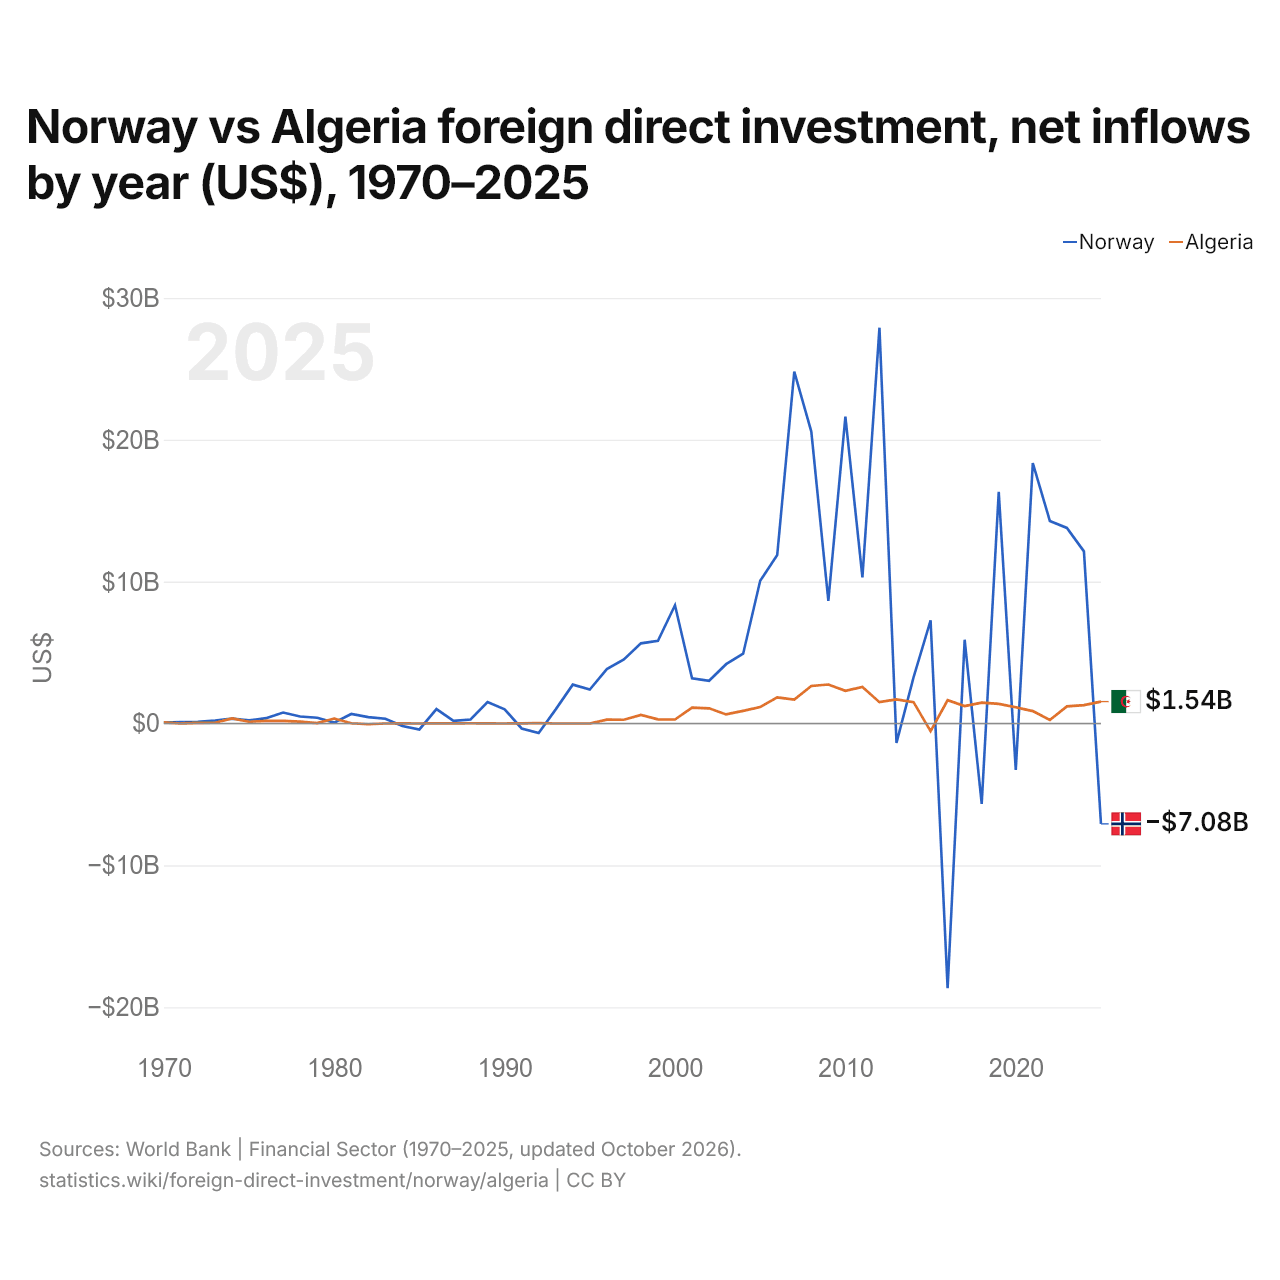
Norvège vs Algérie : investissements directs étrangers, entrées nettes par année ($ US), 1970–2025
| Année | $ US | |
|---|---|---|
 Norvège |
 Algérie |
|
| 2025 | −7 079 264 326 $ US | 1 541 664 825 $ US |
| 2024 | 12 133 906 455 $ US | 1 295 537 014 $ US |
| 2023 | 13 785 279 525 $ US | 1 201 490 230 $ US |
| 2022 | 14 278 134 699 $ US | 241 796 030 $ US |
| 2021 | 18 355 008 694 $ US | 869 194 073 $ US |
| 2020 | −3 281 320 957 $ US | 1 143 918 160 $ US |
| 2019 | 16 329 824 318 $ US | 1 381 200 050 $ US |
| 2018 | −5 664 319 362 $ US | 1 466 116 068 $ US |
| 2017 | 5 900 604 724 $ US | 1 230 243 451 $ US |
| 2016 | −18 668 572 814 $ US | 1 638 263 954 $ US |
| 2015 | 7 274 086 872 $ US | −537 792 921 $ US |
| 2014 | 3 242 240 088 $ US | 1 502 206 171 $ US |
| 2013 | −1 368 607 171 $ US | 1 691 886 708 $ US |
| 2012 | 27 897 968 328 $ US | 1 500 402 453 $ US |
| 2011 | 10 296 323 076 $ US | 2 571 237 025 $ US |
| 2010 | 21 634 265 663 $ US | 2 300 369 124 $ US |
| 2009 | 8 635 762 892 $ US | 2 746 930 734 $ US |
| 2008 | 20 578 219 685 $ US | 2 638 607 034 $ US |
| 2007 | 24 806 091 103 $ US | 1 686 736 540 $ US |
| 2006 | 11 877 923 790 $ US | 1 841 000 000 $ US |
| 2005 | 10 058 759 830 $ US | 1 156 000 000 $ US |
| 2004 | 4 918 494 986 $ US | 884 749 028 $ US |
| 2003 | 4 179 380 423 $ US | 637 853 027 $ US |
| 2002 | 3 011 752 930 $ US | 1 064 960 000 $ US |
| 2001 | 3 190 216 069 $ US | 1 113 105 541 $ US |
| 2000 | 8 332 062 186 $ US | 280 100 000 $ US |
| 1999 | 5 822 113 546 $ US | 291 600 000 $ US |
| 1998 | 5 645 870 321 $ US | 606 600 000 $ US |
| 1997 | 4 514 609 380 $ US | 260 000 000 $ US |
| 1996 | 3 827 495 491 $ US | 270 000 000 $ US |
| 1995 | 2 392 766 980 $ US | 1 000 $ US |
| 1994 | 2 736 393 920 $ US | 1 000 $ US |
| 1993 | 991 524 095 $ US | 1 000 $ US |
| 1992 | −668 114 803 $ US | 30 000 000 $ US |
| 1991 | −353 675 744 $ US | 11 638 686 $ US |
| 1990 | 1 001 987 072 $ US | 334 915 $ US |
| 1989 | 1 510 287 425 $ US | 12 091 647 $ US |
| 1988 | 280 910 587 $ US | 13 018 265 $ US |
| 1987 | 190 047 506 $ US | 3 711 538 $ US |
| 1986 | 1 018 718 112 $ US | 5 316 528 $ US |
| 1985 | −424 225 257 $ US | 397 788 $ US |
| 1984 | −177 399 976 $ US | 802 669 $ US |
| 1983 | 332 396 808 $ US | 417 641 $ US |
| 1982 | 450 026 120 $ US | −53 569 193 $ US |
| 1981 | 668 006 461 $ US | 13 207 259 $ US |
| 1980 | 59 815 998 $ US | 348 669 038 $ US |
| 1979 | 401 356 278 $ US | 25 692 486 $ US |
| 1978 | 489 814 168 $ US | 135 152 172 $ US |
| 1977 | 768 296 210 $ US | 178 452 647 $ US |
| 1976 | 371 391 272 $ US | 187 000 000 $ US |
| 1975 | 219 677 310 $ US | 119 000 000 $ US |
| 1974 | 346 000 000 $ US | 358 000 000 $ US |
| 1973 | 209 000 000 $ US | 51 000 000 $ US |
| 1972 | 121 000 000 $ US | 41 490 000 $ US |
| 1971 | 94 000 000 $ US | 600 000 $ US |
| 1970 | 64 000 000 $ US | 80 120 000 $ US |
En 2025, les entrées nettes d'investissements directs étrangers étaient négatives en Norvège, 7,08 milliards de dollars et de 1,54 milliard de dollars en Algérie. En 1970, elles étaient de 64 millions de dollars en Norvège et de 80,1 millions de dollars en Algérie.
Les entrées nettes d'investissements directs étrangers en Norvège ont été supérieures à celles de l'Algérie pendant 44 des 56 années de 1970 à 2025, et inférieures pendant 12.
Norvège vs Algérie : dernières entrées et sorties d'investissements étrangers
|
Norvège
|
Algérie
|
|
|---|---|---|
| Entrées nettes | −7,08 Md $US | +1,54 Md $US |
| Entrées nettes, % du PIB | −1,3 % | +0,5 % |
| Sorties nettes | +3,37 Md $US | +47,6 M $US |
| Entrées nettes, total 2016–2025 | +46,1 Md $US | +12,0 Md $US |
| Rang mondial | 187/192 | 80/192 |
Comparer les investissements directs étrangers de 2 pays au choix
Sources :
- Banque mondiale | Secteur financier (1970–2025, mis à jour en octobre 2026)
Creative Commons Attribution (CC BY) : vous pouvez copier, partager, adapter et réutiliser ce contenu, y compris à des fins commerciales, à condition de citer statistics.wiki et d’indiquer les modifications apportées. Les sources citées ci-dessus peuvent avoir leurs propres conditions de licence.