
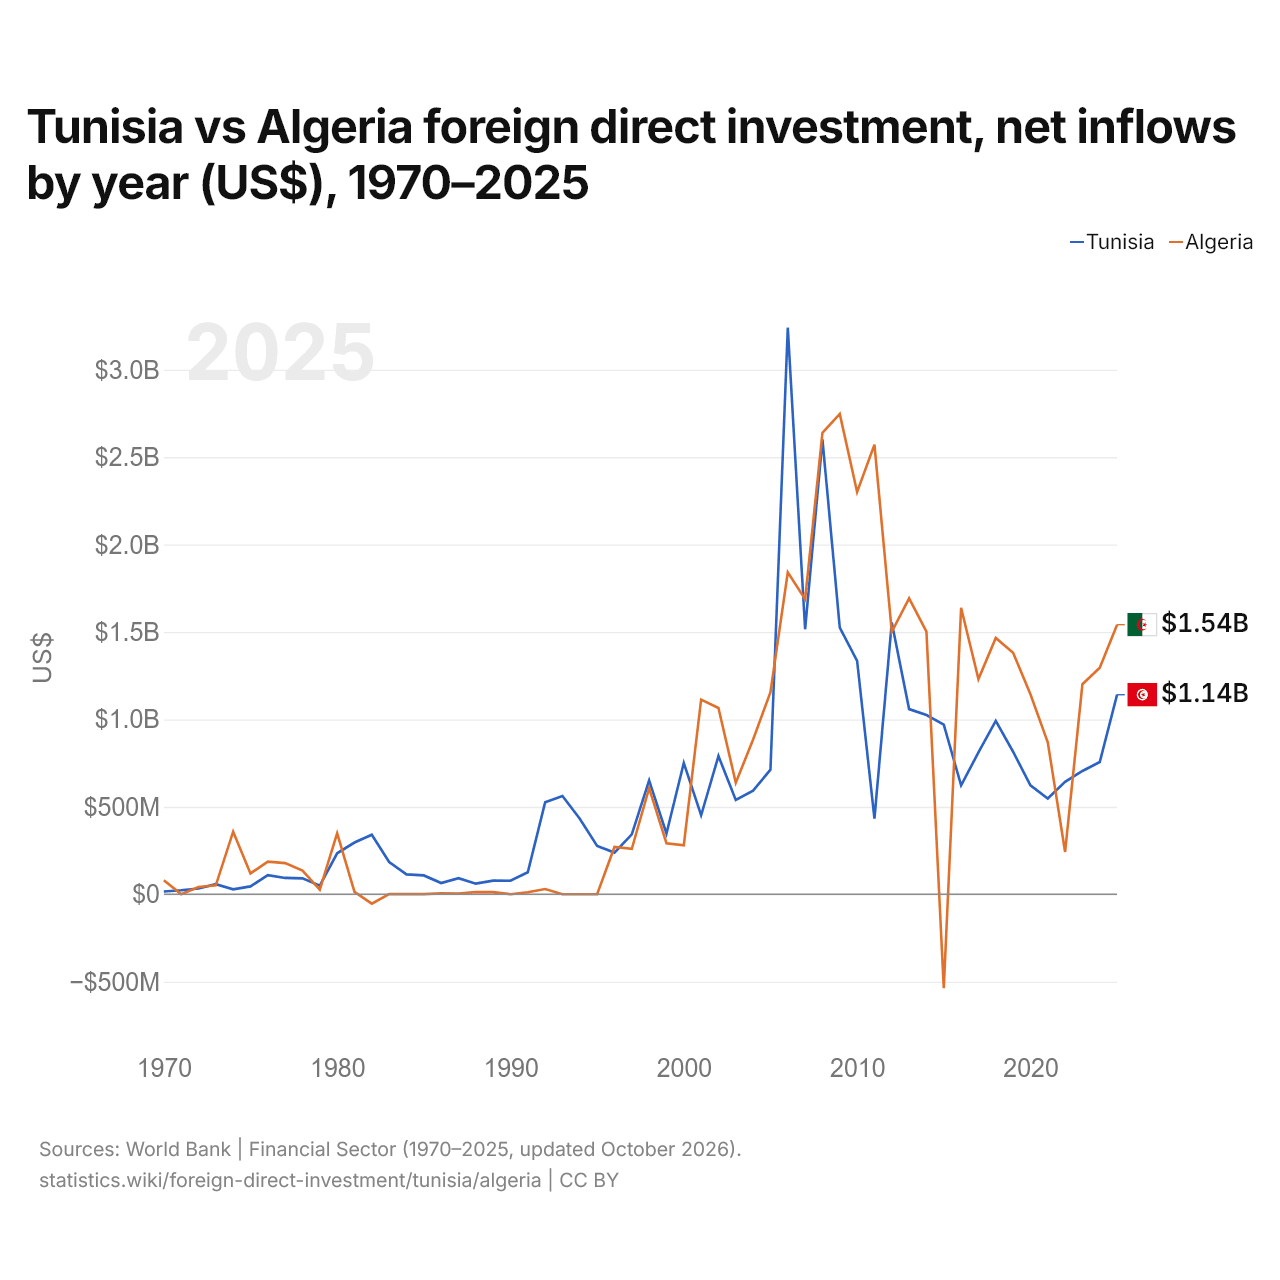
Tunisie vs Algérie : investissements directs étrangers, entrées nettes par année ($ US), 1970–2025
| Année | $ US | |
|---|---|---|
 Tunisie |
 Algérie |
|
| 2025 | 1 141 111 027 $ US | 1 541 664 825 $ US |
| 2024 | 756 453 620 $ US | 1 295 537 014 $ US |
| 2023 | 705 109 053 $ US | 1 201 490 230 $ US |
| 2022 | 643 213 141 $ US | 241 796 030 $ US |
| 2021 | 547 411 354 $ US | 869 194 073 $ US |
| 2020 | 623 075 276 $ US | 1 143 918 160 $ US |
| 2019 | 815 012 991 $ US | 1 381 200 050 $ US |
| 2018 | 991 385 678 $ US | 1 466 116 068 $ US |
| 2017 | 810 936 483 $ US | 1 230 243 451 $ US |
| 2016 | 622 569 482 $ US | 1 638 263 954 $ US |
| 2015 | 970 521 889 $ US | −537 792 921 $ US |
| 2014 | 1 024 754 444 $ US | 1 502 206 171 $ US |
| 2013 | 1 058 622 582 $ US | 1 691 886 708 $ US |
| 2012 | 1 554 269 129 $ US | 1 500 402 453 $ US |
| 2011 | 432 666 012 $ US | 2 571 237 025 $ US |
| 2010 | 1 334 497 695 $ US | 2 300 369 124 $ US |
| 2009 | 1 525 244 858 $ US | 2 746 930 734 $ US |
| 2008 | 2 600 674 976 $ US | 2 638 607 034 $ US |
| 2007 | 1 515 345 044 $ US | 1 686 736 540 $ US |
| 2006 | 3 239 909 093 $ US | 1 841 000 000 $ US |
| 2005 | 712 714 847 $ US | 1 156 000 000 $ US |
| 2004 | 592 147 522 $ US | 884 749 028 $ US |
| 2003 | 539 481 939 $ US | 637 853 027 $ US |
| 2002 | 790 302 917 $ US | 1 064 960 000 $ US |
| 2001 | 451 514 809 $ US | 1 113 105 541 $ US |
| 2000 | 750 720 444 $ US | 280 100 000 $ US |
| 1999 | 347 320 281 $ US | 291 600 000 $ US |
| 1998 | 650 727 788 $ US | 606 600 000 $ US |
| 1997 | 342 704 715 $ US | 260 000 000 $ US |
| 1996 | 238 337 799 $ US | 270 000 000 $ US |
| 1995 | 275 971 451 $ US | 1 000 $ US |
| 1994 | 432 008 502 $ US | 1 000 $ US |
| 1993 | 561 897 567 $ US | 1 000 $ US |
| 1992 | 525 760 374 $ US | 30 000 000 $ US |
| 1991 | 125 456 831 $ US | 11 638 686 $ US |
| 1990 | 77 419 355 $ US | 334 915 $ US |
| 1989 | 77 950 465 $ US | 12 091 647 $ US |
| 1988 | 60 619 897 $ US | 13 018 265 $ US |
| 1987 | 91 714 057 $ US | 3 711 538 $ US |
| 1986 | 64 229 379 $ US | 5 316 528 $ US |
| 1985 | 107 849 550 $ US | 397 788 $ US |
| 1984 | 113 280 412 $ US | 802 669 $ US |
| 1983 | 184 157 541 $ US | 417 641 $ US |
| 1982 | 340 281 452 $ US | −53 569 193 $ US |
| 1981 | 295 663 767 $ US | 13 207 259 $ US |
| 1980 | 234 594 451 $ US | 348 669 038 $ US |
| 1979 | 49 205 031 $ US | 25 692 486 $ US |
| 1978 | 91 308 658 $ US | 135 152 172 $ US |
| 1977 | 93 250 962 $ US | 178 452 647 $ US |
| 1976 | 109 614 600 $ US | 187 000 000 $ US |
| 1975 | 45 000 000 $ US | 119 000 000 $ US |
| 1974 | 28 000 000 $ US | 358 000 000 $ US |
| 1973 | 58 000 000 $ US | 51 000 000 $ US |
| 1972 | 33 000 000 $ US | 41 490 000 $ US |
| 1971 | 23 000 000 $ US | 600 000 $ US |
| 1970 | 16 000 000 $ US | 80 120 000 $ US |
En 2025, les entrées nettes d'investissements directs étrangers étaient de 1,14 milliard de dollars en Tunisie et de 1,54 milliard de dollars en Algérie : 35 % de plus en Algérie. En 1970, elles étaient de 16 millions de dollars en Tunisie et de 80,1 millions de dollars en Algérie.
Les entrées nettes d'investissements directs étrangers en Tunisie ont été supérieures à celles de l'Algérie pendant 26 des 56 années de 1970 à 2025, et inférieures pendant 30.
Tunisie vs Algérie : dernières entrées et sorties d'investissements étrangers
|
Tunisie
|
Algérie
|
|
|---|---|---|
| Entrées nettes | +1,14 Md $US | +1,54 Md $US |
| Entrées nettes, % du PIB | +2,0 % | +0,5 % |
| Sorties nettes | +23,7 M $US | +47,6 M $US |
| Entrées nettes, total 2016–2025 | +7,66 Md $US | +12,0 Md $US |
| Rang mondial | 88/192 | 80/192 |
Comparer les investissements directs étrangers de 2 pays au choix
Sources :
- Banque mondiale | Secteur financier (1970–2025, mis à jour en octobre 2026)
Creative Commons Attribution (CC BY) : vous pouvez copier, partager, adapter et réutiliser ce contenu, y compris à des fins commerciales, à condition de citer statistics.wiki et d’indiquer les modifications apportées. Les sources citées ci-dessus peuvent avoir leurs propres conditions de licence.