
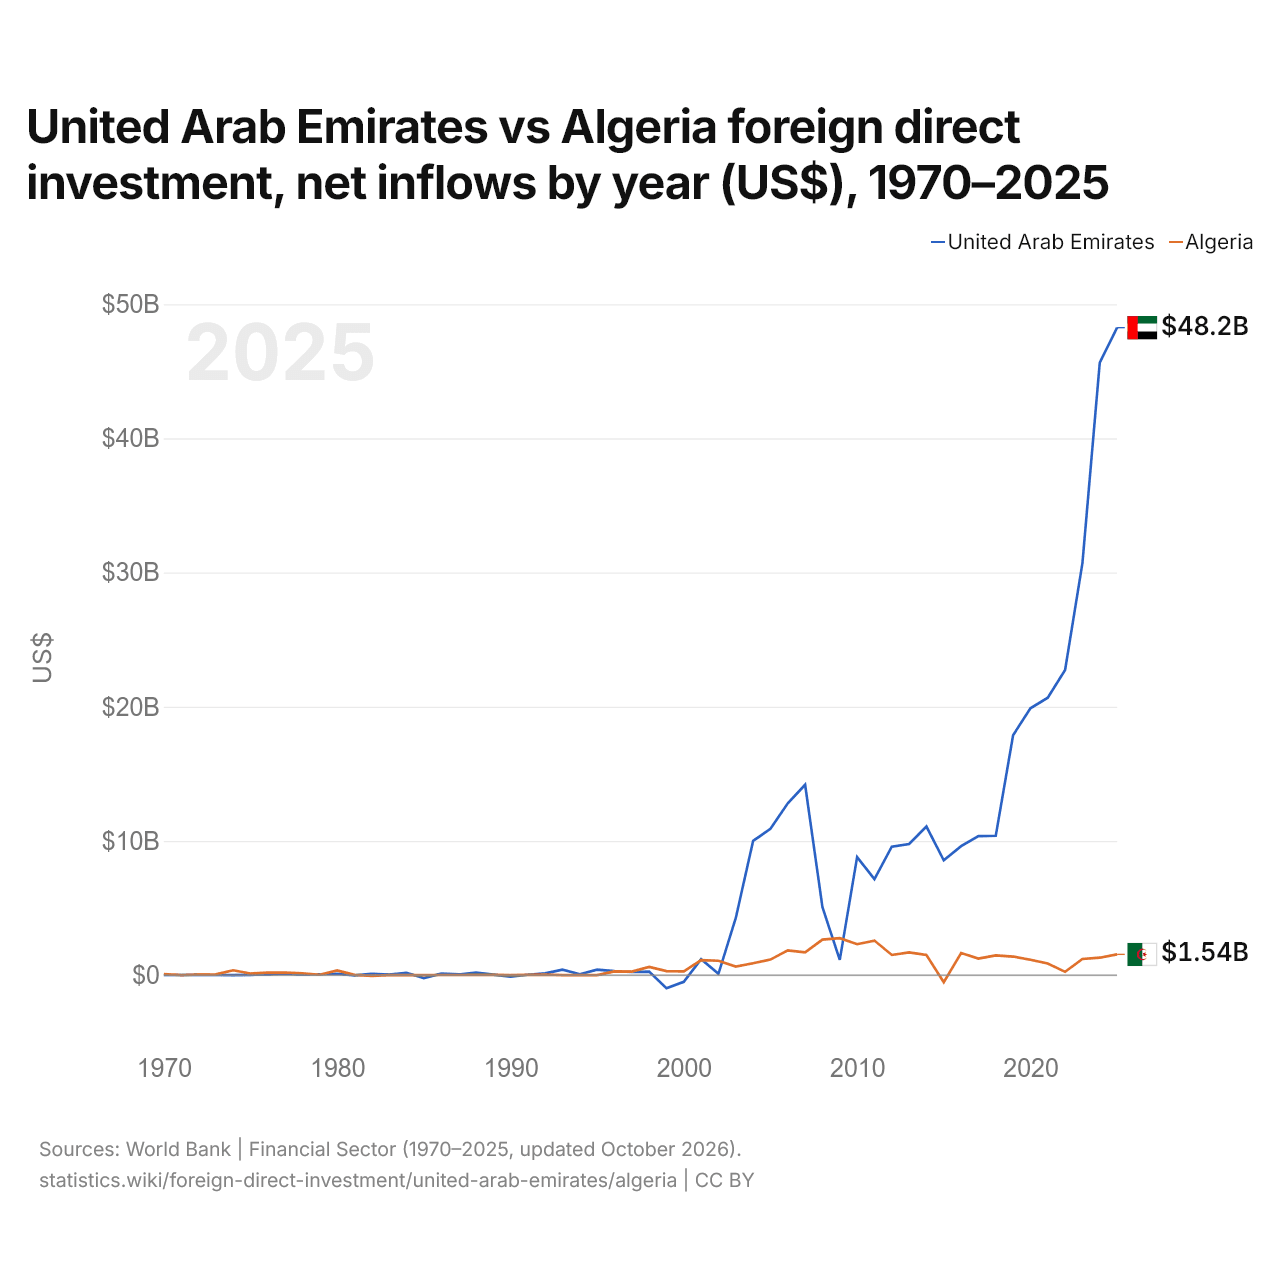
Émirats arabes unis vs Algérie : investissements directs étrangers, entrées nettes par année ($ US), 1970–2025
| Année | $ US | |
|---|---|---|
 EAU |
 Algérie |
|
| 2025 | 48 243 430 905 $ US | 1 541 664 825 $ US |
| 2024 | 45 631 831 178 $ US | 1 295 537 014 $ US |
| 2023 | 30 700 013 615 $ US | 1 201 490 230 $ US |
| 2022 | 22 736 555 480 $ US | 241 796 030 $ US |
| 2021 | 20 667 120 000 $ US | 869 194 073 $ US |
| 2020 | 19 884 470 000 $ US | 1 143 918 160 $ US |
| 2019 | 17 874 660 000 $ US | 1 381 200 050 $ US |
| 2018 | 10 385 286 000 $ US | 1 466 116 068 $ US |
| 2017 | 10 354 223 000 $ US | 1 230 243 451 $ US |
| 2016 | 9 604 773 000 $ US | 1 638 263 954 $ US |
| 2015 | 8 550 901 847 $ US | −537 792 921 $ US |
| 2014 | 11 071 537 020 $ US | 1 502 206 171 $ US |
| 2013 | 9 764 914 527 $ US | 1 691 886 708 $ US |
| 2012 | 9 566 651 351 $ US | 1 500 402 453 $ US |
| 2011 | 7 152 095 826 $ US | 2 571 237 025 $ US |
| 2010 | 8 796 769 641 $ US | 2 300 369 124 $ US |
| 2009 | 1 134 288 135 $ US | 2 746 930 734 $ US |
| 2008 | 5 062 972 005 $ US | 2 638 607 034 $ US |
| 2007 | 14 186 521 443 $ US | 1 686 736 540 $ US |
| 2006 | 12 805 990 470 $ US | 1 841 000 000 $ US |
| 2005 | 10 899 931 926 $ US | 1 156 000 000 $ US |
| 2004 | 10 003 500 000 $ US | 884 749 028 $ US |
| 2003 | 4 255 956 433 $ US | 637 853 027 $ US |
| 2002 | 95 300 000 $ US | 1 064 960 000 $ US |
| 2001 | 1 183 840 000 $ US | 1 113 105 541 $ US |
| 2000 | −506 330 000 $ US | 280 100 000 $ US |
| 1999 | −985 340 000 $ US | 291 600 000 $ US |
| 1998 | 257 660 000 $ US | 606 600 000 $ US |
| 1997 | 232 430 000 $ US | 260 000 000 $ US |
| 1996 | 300 520 000 $ US | 270 000 000 $ US |
| 1995 | 399 850 000 $ US | 1 000 $ US |
| 1994 | 62 460 000 $ US | 1 000 $ US |
| 1993 | 401 320 000 $ US | 1 000 $ US |
| 1992 | 129 720 000 $ US | 30 000 000 $ US |
| 1991 | 25 940 000 $ US | 11 638 686 $ US |
| 1990 | −115 820 000 $ US | 334 915 $ US |
| 1989 | 38 790 000 $ US | 12 091 647 $ US |
| 1988 | 188 890 000 $ US | 13 018 265 $ US |
| 1987 | 46 720 000 $ US | 3 711 538 $ US |
| 1986 | 110 210 000 $ US | 5 316 528 $ US |
| 1985 | −220 960 000 $ US | 397 788 $ US |
| 1984 | 170 240 000 $ US | 802 669 $ US |
| 1983 | 45 540 000 $ US | 417 641 $ US |
| 1982 | 95 060 000 $ US | −53 569 193 $ US |
| 1981 | −16 940 000 $ US | 13 207 259 $ US |
| 1980 | 97 640 000 $ US | 348 669 038 $ US |
| 1979 | 64 580 000 $ US | 25 692 486 $ US |
| 1978 | 39 120 000 $ US | 135 152 172 $ US |
| 1977 | 112 240 000 $ US | 178 452 647 $ US |
| 1976 | 49 430 000 $ US | 187 000 000 $ US |
| 1975 | 15 950 000 $ US | 119 000 000 $ US |
| 1974 | 1 630 000 $ US | 358 000 000 $ US |
| 1973 | 3 410 000 $ US | 51 000 000 $ US |
| 1972 | 10 510 000 $ US | 41 490 000 $ US |
| 1971 | 6 940 000 $ US | 600 000 $ US |
| 1970 | 7 780 000 $ US | 80 120 000 $ US |
En 2025, les entrées nettes d'investissements directs étrangers étaient de 48,2 milliards de dollars aux Émirats arabes unis et de 1,54 milliard de dollars en Algérie : 31 fois plus aux Émirats arabes unis. En 1970, elles étaient de 7,78 millions de dollars aux Émirats arabes unis et de 80,1 millions de dollars en Algérie.
Les entrées nettes d'investissements directs étrangers aux Émirats arabes unis ont été supérieures à celles de l'Algérie pendant 38 des 56 années de 1970 à 2025, et inférieures pendant 18.
Émirats arabes unis vs Algérie : dernières entrées et sorties d'investissements étrangers
|
EAU
|
Algérie
|
|
|---|---|---|
| Entrées nettes | +48,2 Md $US | +1,54 Md $US |
| Entrées nettes, % du PIB | n.d. | +0,5 % |
| Sorties nettes | +63,4 Md $US | +47,6 M $US |
| Entrées nettes, total 2016–2025 | +236 Md $US | +12,0 Md $US |
| Rang mondial | 9/192 | 80/192 |
Comparer les investissements directs étrangers de 2 pays au choix
Sources :
- Banque mondiale | Secteur financier (1970–2025, mis à jour en octobre 2026)
Creative Commons Attribution (CC BY) : vous pouvez copier, partager, adapter et réutiliser ce contenu, y compris à des fins commerciales, à condition de citer statistics.wiki et d’indiquer les modifications apportées. Les sources citées ci-dessus peuvent avoir leurs propres conditions de licence.