
Pologne vs Algérie : investissements directs étrangers, entrées nettes par année ($ US), 1970–2025
| Année | $ US | |
|---|---|---|
 Pologne |
 Algérie |
|
| 2025 | 20 940 000 000 $ US | 1 541 664 825 $ US |
| 2024 | 20 606 000 000 $ US | 1 295 537 014 $ US |
| 2023 | 35 660 000 000 $ US | 1 201 490 230 $ US |
| 2022 | 41 780 000 000 $ US | 241 796 030 $ US |
| 2021 | 37 512 000 000 $ US | 869 194 073 $ US |
| 2020 | 20 086 000 000 $ US | 1 143 918 160 $ US |
| 2019 | 19 012 000 000 $ US | 1 381 200 050 $ US |
| 2018 | 19 908 000 000 $ US | 1 466 116 068 $ US |
| 2017 | 12 565 000 000 $ US | 1 230 243 451 $ US |
| 2016 | 18 060 000 000 $ US | 1 638 263 954 $ US |
| 2015 | 15 820 000 000 $ US | −537 792 921 $ US |
| 2014 | 20 877 000 000 $ US | 1 502 206 171 $ US |
| 2013 | 1 342 000 000 $ US | 1 691 886 708 $ US |
| 2012 | 7 616 000 000 $ US | 1 500 402 453 $ US |
| 2011 | 18 851 000 000 $ US | 2 571 237 025 $ US |
| 2010 | 18 861 000 000 $ US | 2 300 369 124 $ US |
| 2009 | 14 025 000 000 $ US | 2 746 930 734 $ US |
| 2008 | 14 574 000 000 $ US | 2 638 607 034 $ US |
| 2007 | 25 031 000 000 $ US | 1 686 736 540 $ US |
| 2006 | 21 473 000 000 $ US | 1 841 000 000 $ US |
| 2005 | 11 041 000 000 $ US | 1 156 000 000 $ US |
| 2004 | 13 868 000 000 $ US | 884 749 028 $ US |
| 2003 | 5 371 000 000 $ US | 637 853 027 $ US |
| 2002 | 4 091 000 000 $ US | 1 064 960 000 $ US |
| 2001 | 5 677 000 000 $ US | 1 113 105 541 $ US |
| 2000 | 9 335 000 000 $ US | 280 100 000 $ US |
| 1999 | 7 407 000 000 $ US | 291 600 000 $ US |
| 1998 | 6 383 000 000 $ US | 606 600 000 $ US |
| 1997 | 4 910 000 000 $ US | 260 000 000 $ US |
| 1996 | 4 500 000 000 $ US | 270 000 000 $ US |
| 1995 | 3 659 000 000 $ US | 1 000 $ US |
| 1994 | 1 875 000 000 $ US | 1 000 $ US |
| 1993 | 1 715 000 000 $ US | 1 000 $ US |
| 1992 | 678 000 000 $ US | 30 000 000 $ US |
| 1991 | 291 000 000 $ US | 11 638 686 $ US |
| 1990 | 89 000 000 $ US | 334 915 $ US |
| 1989 | 11 000 000 $ US | 12 091 647 $ US |
| 1988 | 15 000 000 $ US | 13 018 265 $ US |
| 1987 | 12 000 000 $ US | 3 711 538 $ US |
| 1986 | 16 000 000 $ US | 5 316 528 $ US |
| 1985 | 15 000 000 $ US | 397 788 $ US |
| 1984 | 28 000 000 $ US | 802 669 $ US |
| 1983 | 16 000 000 $ US | 417 641 $ US |
| 1982 | 14 000 000 $ US | −53 569 193 $ US |
| 1981 | 18 000 000 $ US | 13 207 259 $ US |
| 1980 | 10 000 000 $ US | 348 669 038 $ US |
| 1979 | 30 000 000 $ US | 25 692 486 $ US |
| 1978 | 25 000 000 $ US | 135 152 172 $ US |
| 1977 | 5 000 000 $ US | 178 452 647 $ US |
| 1976 | 6 000 000 $ US | 187 000 000 $ US |
| 1975 | - | 119 000 000 $ US |
| 1974 | - | 358 000 000 $ US |
| 1973 | - | 51 000 000 $ US |
| 1972 | - | 41 490 000 $ US |
| 1971 | - | 600 000 $ US |
| 1970 | - | 80 120 000 $ US |
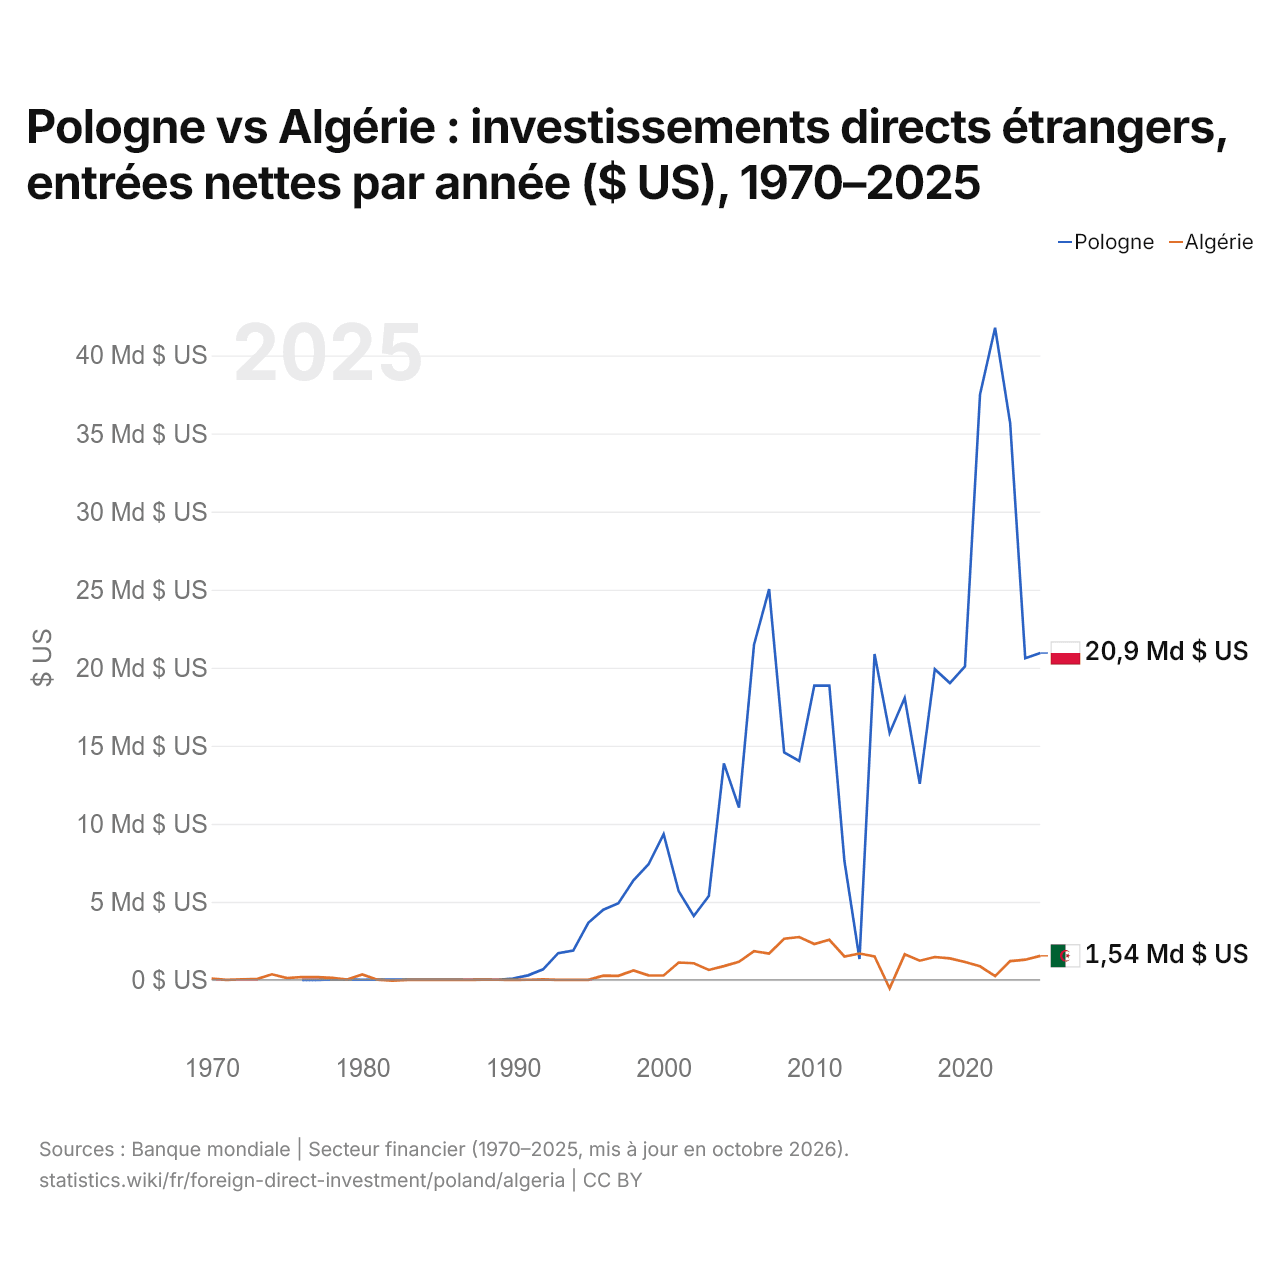
En 2025, les entrées nettes d'investissements directs étrangers étaient de 20,9 milliards de dollars en Pologne et de 1,54 milliard de dollars en Algérie : 14 fois plus en Pologne. En 1976, elles étaient de 6 millions de dollars en Pologne et de 187 millions de dollars en Algérie.
Les entrées nettes d'investissements directs étrangers en Pologne ont été supérieures à celles de l'Algérie pendant 44 des 50 années de 1976 à 2025, et inférieures pendant 6.
Pologne vs Algérie : dernières entrées et sorties d'investissements étrangers
|
Pologne
|
Algérie
|
|
|---|---|---|
| Entrées nettes | +20,9 Md $US | +1,54 Md $US |
| Entrées nettes, % du PIB | +2,0 % | +0,5 % |
| Sorties nettes | +8,24 Md $US | +47,6 M $US |
| Entrées nettes, total 2016–2025 | +246 Md $US | +12,0 Md $US |
| Rang mondial | 22/192 | 80/192 |
Comparer les investissements directs étrangers de 2 pays au choix
Sources :
- Banque mondiale | Secteur financier (1970–2025, mis à jour en octobre 2026)
Creative Commons Attribution (CC BY) : vous pouvez copier, partager, adapter et réutiliser ce contenu, y compris à des fins commerciales, à condition de citer statistics.wiki et d’indiquer les modifications apportées. Les sources citées ci-dessus peuvent avoir leurs propres conditions de licence.