
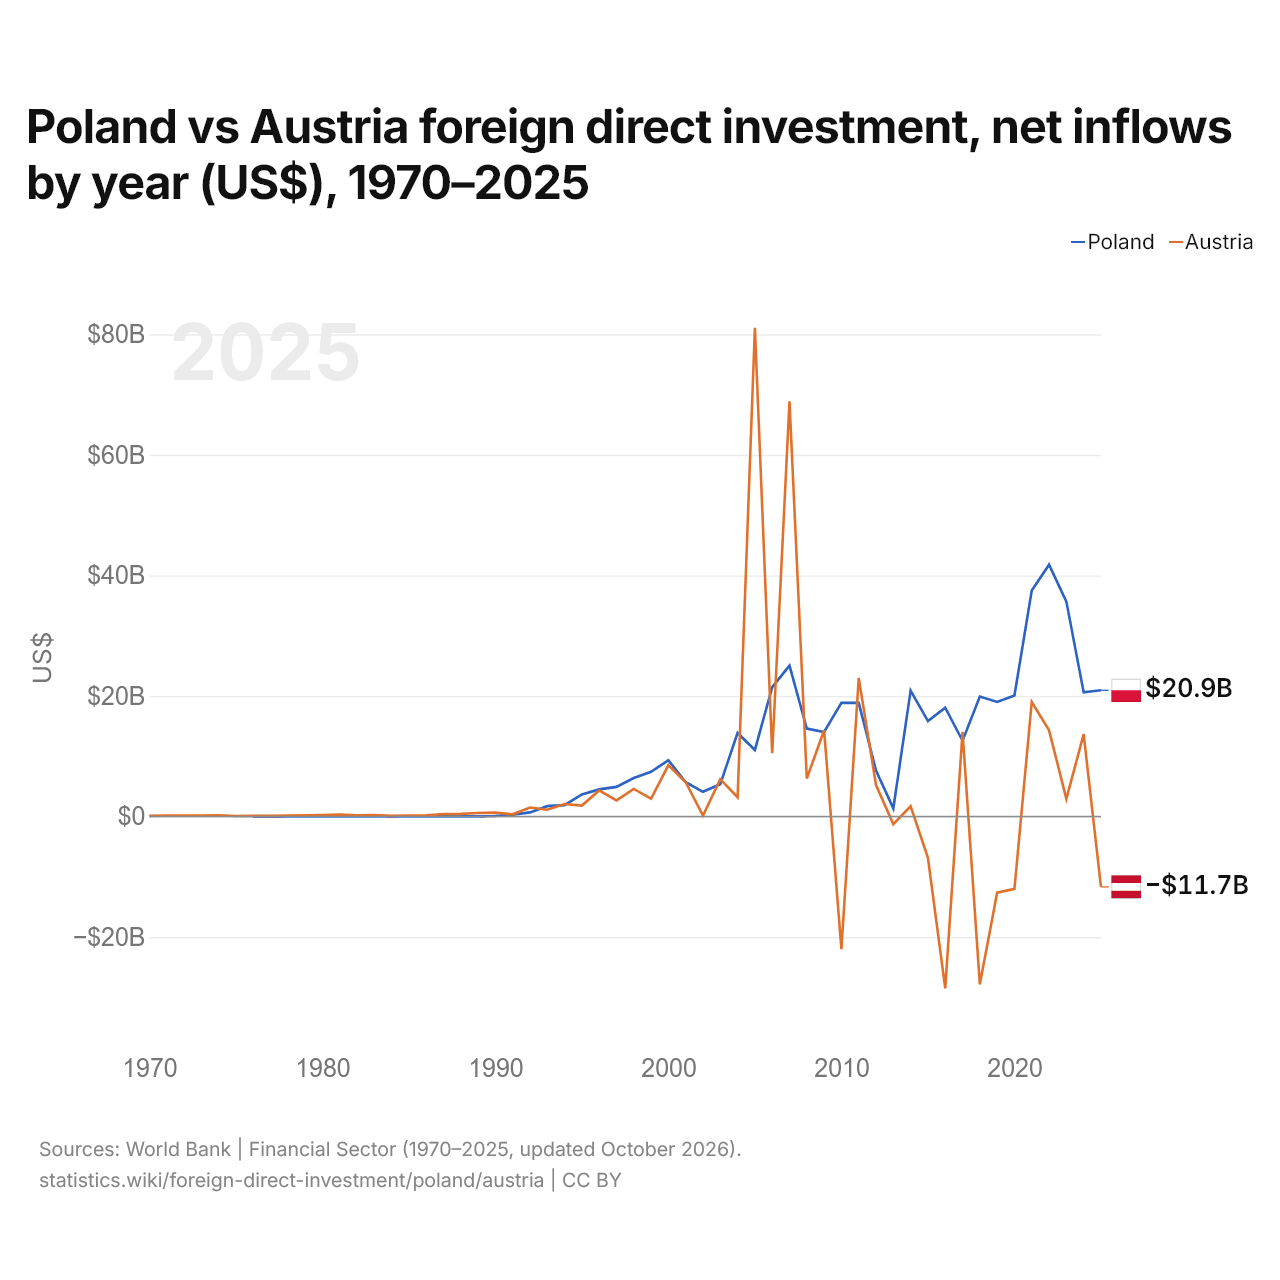
Pologne vs Autriche : investissements directs étrangers, entrées nettes par année ($ US), 1970–2025
| Année | $ US | |
|---|---|---|
 Pologne |
 Autriche |
|
| 2025 | 20 940 000 000 $ US | −11 681 041 500 $ US |
| 2024 | 20 606 000 000 $ US | 13 655 965 523 $ US |
| 2023 | 35 660 000 000 $ US | 2 924 935 669 $ US |
| 2022 | 41 780 000 000 $ US | 14 301 504 457 $ US |
| 2021 | 37 512 000 000 $ US | 18 998 114 634 $ US |
| 2020 | 20 086 000 000 $ US | −12 003 798 873 $ US |
| 2019 | 19 012 000 000 $ US | −12 636 357 247 $ US |
| 2018 | 19 908 000 000 $ US | −27 839 206 246 $ US |
| 2017 | 12 565 000 000 $ US | 14 031 983 575 $ US |
| 2016 | 18 060 000 000 $ US | −28 502 567 388 $ US |
| 2015 | 15 820 000 000 $ US | −6 847 372 584 $ US |
| 2014 | 20 877 000 000 $ US | 1 708 425 860 $ US |
| 2013 | 1 342 000 000 $ US | −1 290 975 417 $ US |
| 2012 | 7 616 000 000 $ US | 5 218 620 113 $ US |
| 2011 | 18 851 000 000 $ US | 22 983 942 932 $ US |
| 2010 | 18 861 000 000 $ US | −22 007 325 156 $ US |
| 2009 | 14 025 000 000 $ US | 14 300 064 389 $ US |
| 2008 | 14 574 000 000 $ US | 6 301 143 682 $ US |
| 2007 | 25 031 000 000 $ US | 68 865 787 583 $ US |
| 2006 | 21 473 000 000 $ US | 10 500 457 158 $ US |
| 2005 | 11 041 000 000 $ US | 81 096 089 418 $ US |
| 2004 | 13 868 000 000 $ US | 3 183 649 650 $ US |
| 2003 | 5 371 000 000 $ US | 6 195 021 861 $ US |
| 2002 | 4 091 000 000 $ US | 138 346 431 $ US |
| 2001 | 5 677 000 000 $ US | 5 689 434 546 $ US |
| 2000 | 9 335 000 000 $ US | 8 501 013 451 $ US |
| 1999 | 7 407 000 000 $ US | 2 974 499 988 $ US |
| 1998 | 6 383 000 000 $ US | 4 571 855 707 $ US |
| 1997 | 4 910 000 000 $ US | 2 668 974 816 $ US |
| 1996 | 4 500 000 000 $ US | 4 323 513 092 $ US |
| 1995 | 3 659 000 000 $ US | 1 825 090 253 $ US |
| 1994 | 1 875 000 000 $ US | 2 075 823 594 $ US |
| 1993 | 1 715 000 000 $ US | 1 125 106 122 $ US |
| 1992 | 678 000 000 $ US | 1 485 517 753 $ US |
| 1991 | 291 000 000 $ US | 360 000 000 $ US |
| 1990 | 89 000 000 $ US | 653 000 000 $ US |
| 1989 | 11 000 000 $ US | 581 979 789 $ US |
| 1988 | 15 000 000 $ US | 445 427 084 $ US |
| 1987 | 12 000 000 $ US | 395 491 398 $ US |
| 1986 | 16 000 000 $ US | 183 400 908 $ US |
| 1985 | 15 000 000 $ US | 169 167 935 $ US |
| 1984 | 28 000 000 $ US | 115 240 000 $ US |
| 1983 | 16 000 000 $ US | 216 120 000 $ US |
| 1982 | 14 000 000 $ US | 207 920 000 $ US |
| 1981 | 18 000 000 $ US | 327 520 000 $ US |
| 1980 | 10 000 000 $ US | 239 300 000 $ US |
| 1979 | 30 000 000 $ US | 187 430 000 $ US |
| 1978 | 25 000 000 $ US | 142 390 000 $ US |
| 1977 | 5 000 000 $ US | 96 810 000 $ US |
| 1976 | 6 000 000 $ US | 91 230 000 $ US |
| 1975 | - | 79 110 000 $ US |
| 1974 | - | 177 050 000 $ US |
| 1973 | - | 160 760 000 $ US |
| 1972 | - | 145 400 000 $ US |
| 1971 | - | 142 730 000 $ US |
| 1970 | - | 112 650 000 $ US |
En 2025, les entrées nettes d'investissements directs étrangers étaient de 20,9 milliards de dollars en Pologne et négatives en Autriche, 11,7 milliards de dollars. En 1976, elles étaient de 6 millions de dollars en Pologne et de 91,2 millions de dollars en Autriche.
Les entrées nettes d'investissements directs étrangers en Pologne ont été supérieures à celles de l'Autriche pendant 25 des 50 années de 1976 à 2025, et inférieures pendant 25.
Pologne vs Autriche : dernières entrées et sorties d'investissements étrangers
|
Pologne
|
Autriche
|
|
|---|---|---|
| Entrées nettes | +20,9 Md $US | −11,7 Md $US |
| Entrées nettes, % du PIB | +2,0 % | −2,0 % |
| Sorties nettes | +8,24 Md $US | −6,07 Md $US |
| Entrées nettes, total 2016–2025 | +246 Md $US | −28,8 Md $US |
| Rang mondial | 22/192 | 189/192 |
Comparer les investissements directs étrangers de 2 pays au choix
Sources :
- Banque mondiale | Secteur financier (1970–2025, mis à jour en octobre 2026)
Creative Commons Attribution (CC BY) : vous pouvez copier, partager, adapter et réutiliser ce contenu, y compris à des fins commerciales, à condition de citer statistics.wiki et d’indiquer les modifications apportées. Les sources citées ci-dessus peuvent avoir leurs propres conditions de licence.