
Royaume-Uni vs Pologne : investissements directs étrangers, entrées nettes par année ($ US), 1970–2025
| Année | $ US | |
|---|---|---|
 Royaume-Uni |
 Pologne |
|
| 2025 | 37 588 831 511 $ US | 20 940 000 000 $ US |
| 2024 | −12 955 141 485 $ US | 20 606 000 000 $ US |
| 2023 | 13 789 803 776 $ US | 35 660 000 000 $ US |
| 2022 | 92 776 358 059 $ US | 41 780 000 000 $ US |
| 2021 | 102 431 564 639 $ US | 37 512 000 000 $ US |
| 2020 | 157 185 559 300 $ US | 20 086 000 000 $ US |
| 2019 | 19 790 761 929 $ US | 19 012 000 000 $ US |
| 2018 | −25 055 440 307 $ US | 19 908 000 000 $ US |
| 2017 | 125 358 809 934 $ US | 12 565 000 000 $ US |
| 2016 | 324 813 224 213 $ US | 18 060 000 000 $ US |
| 2015 | 45 333 483 122 $ US | 15 820 000 000 $ US |
| 2014 | 58 890 445 253 $ US | 20 877 000 000 $ US |
| 2013 | 54 473 175 400 $ US | 1 342 000 000 $ US |
| 2012 | 46 750 789 728 $ US | 7 616 000 000 $ US |
| 2011 | 27 012 050 072 $ US | 18 851 000 000 $ US |
| 2010 | 66 734 551 294 $ US | 18 861 000 000 $ US |
| 2009 | 14 547 108 445 $ US | 14 025 000 000 $ US |
| 2008 | 253 454 117 907 $ US | 14 574 000 000 $ US |
| 2007 | 209 514 959 647 $ US | 25 031 000 000 $ US |
| 2006 | 203 636 431 868 $ US | 21 473 000 000 $ US |
| 2005 | 252 653 397 148 $ US | 11 041 000 000 $ US |
| 2004 | 87 059 621 382 $ US | 13 868 000 000 $ US |
| 2003 | 36 011 240 473 $ US | 5 371 000 000 $ US |
| 2002 | 89 760 582 753 $ US | 4 091 000 000 $ US |
| 2001 | 56 090 924 809 $ US | 5 677 000 000 $ US |
| 2000 | 164 130 335 444 $ US | 9 335 000 000 $ US |
| 1999 | 129 891 584 490 $ US | 7 407 000 000 $ US |
| 1998 | 109 817 612 847 $ US | 6 383 000 000 $ US |
| 1997 | 51 311 836 384 $ US | 4 910 000 000 $ US |
| 1996 | 32 412 668 835 $ US | 4 500 000 000 $ US |
| 1995 | 29 129 258 041 $ US | 3 659 000 000 $ US |
| 1994 | 19 561 337 402 $ US | 1 875 000 000 $ US |
| 1993 | 19 686 257 927 $ US | 1 715 000 000 $ US |
| 1992 | 23 011 210 834 $ US | 678 000 000 $ US |
| 1991 | 23 244 186 242 $ US | 291 000 000 $ US |
| 1990 | 41 363 405 439 $ US | 89 000 000 $ US |
| 1989 | 27 108 240 789 $ US | 11 000 000 $ US |
| 1988 | 26 430 921 298 $ US | 15 000 000 $ US |
| 1987 | 13 074 923 702 $ US | 12 000 000 $ US |
| 1986 | 8 569 621 722 $ US | 16 000 000 $ US |
| 1985 | 5 476 472 897 $ US | 15 000 000 $ US |
| 1984 | −347 322 545 $ US | 28 000 000 $ US |
| 1983 | 5 178 781 726 $ US | 16 000 000 $ US |
| 1982 | 5 413 259 759 $ US | 14 000 000 $ US |
| 1981 | 5 879 375 698 $ US | 18 000 000 $ US |
| 1980 | 10 122 844 316 $ US | 10 000 000 $ US |
| 1979 | 6 469 481 160 $ US | 30 000 000 $ US |
| 1978 | 3 787 370 849 $ US | 25 000 000 $ US |
| 1977 | 4 426 545 754 $ US | 5 000 000 $ US |
| 1976 | 3 006 207 709 $ US | 6 000 000 $ US |
| 1975 | 3 318 535 790 $ US | - |
| 1974 | 4 373 743 380 $ US | - |
| 1973 | 2 722 732 320 $ US | - |
| 1972 | 1 207 963 191 $ US | - |
| 1971 | 1 771 224 349 $ US | - |
| 1970 | 1 487 998 812 $ US | - |
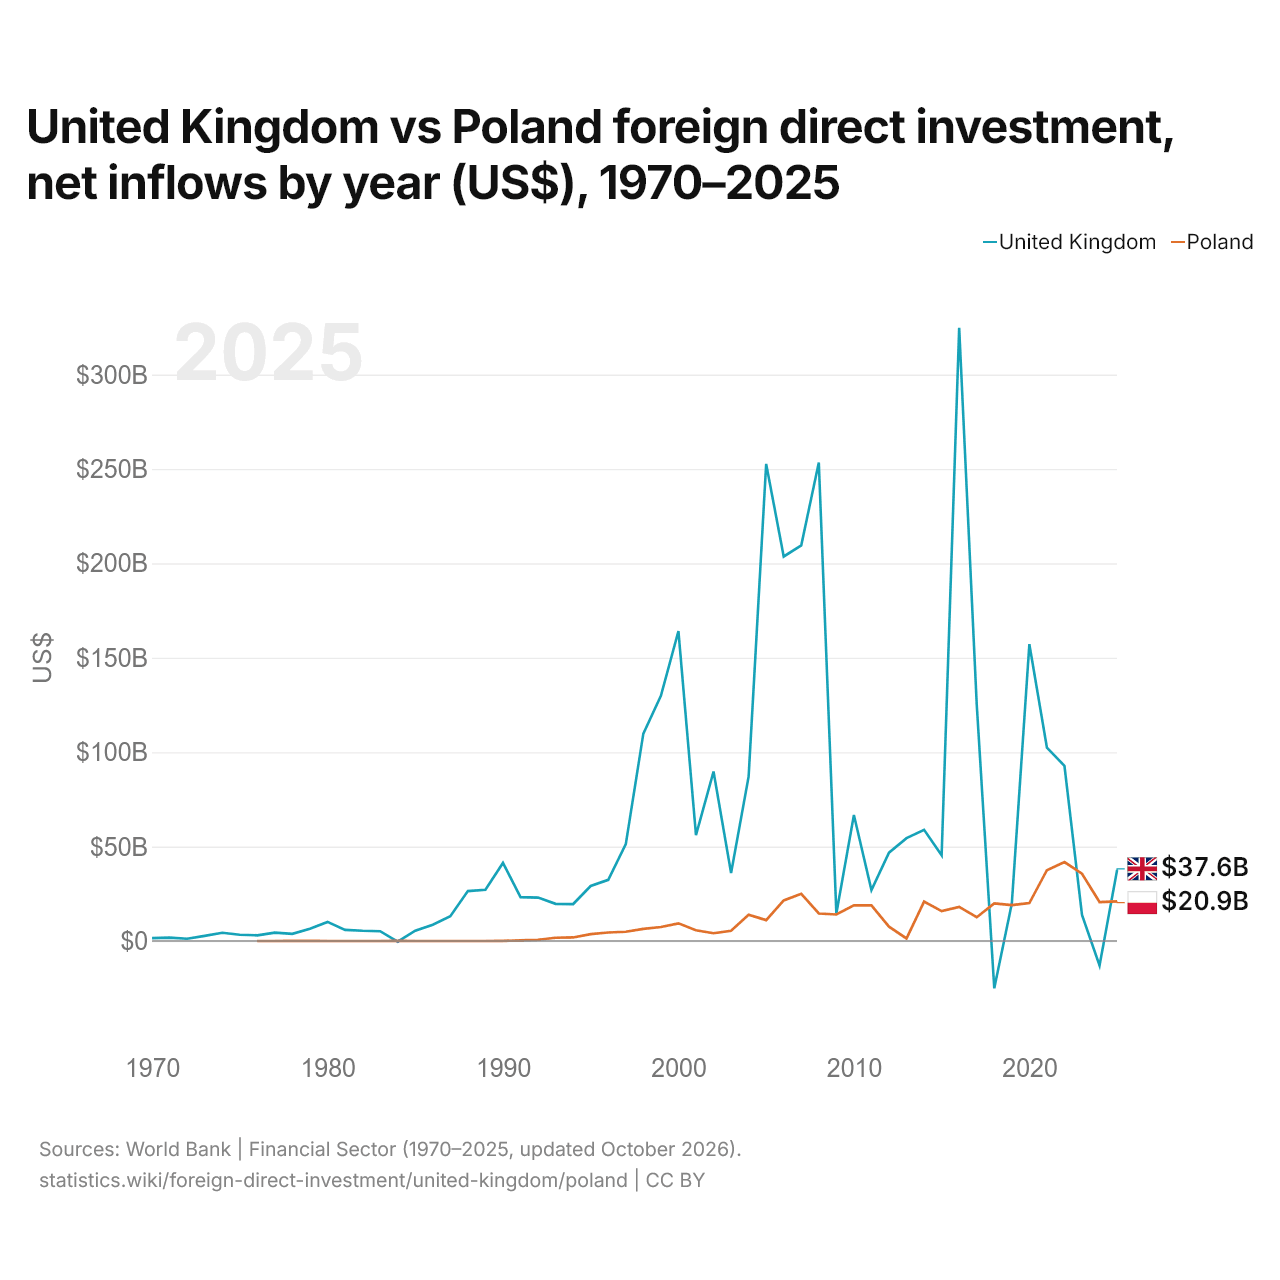
En 2025, les entrées nettes d'investissements directs étrangers étaient de 37,6 milliards de dollars au Royaume-Uni et de 20,9 milliards de dollars en Pologne : 1,8 fois plus au Royaume-Uni. En 1976, elles étaient de 3,01 milliards de dollars au Royaume-Uni et de 6 millions de dollars en Pologne.
Les entrées nettes d'investissements directs étrangers au Royaume-Uni ont été supérieures à celles de la Pologne pendant 46 des 50 années de 1976 à 2025, et inférieures pendant 4.
Royaume-Uni vs Pologne : dernières entrées et sorties d'investissements étrangers
|
Royaume-Uni
|
Pologne
|
|
|---|---|---|
| Entrées nettes | +37,6 Md $US | +20,9 Md $US |
| Entrées nettes, % du PIB | +0,9 % | +2,0 % |
| Sorties nettes | +9,43 Md $US | +8,24 Md $US |
| Entrées nettes, total 2016–2025 | +836 Md $US | +246 Md $US |
| Rang mondial | 13/192 | 22/192 |
Comparer les investissements directs étrangers de 2 pays au choix
Sources :
- Banque mondiale | Secteur financier (1970–2025, mis à jour en octobre 2026)
Creative Commons Attribution (CC BY) : vous pouvez copier, partager, adapter et réutiliser ce contenu, y compris à des fins commerciales, à condition de citer statistics.wiki et d’indiquer les modifications apportées. Les sources citées ci-dessus peuvent avoir leurs propres conditions de licence.