
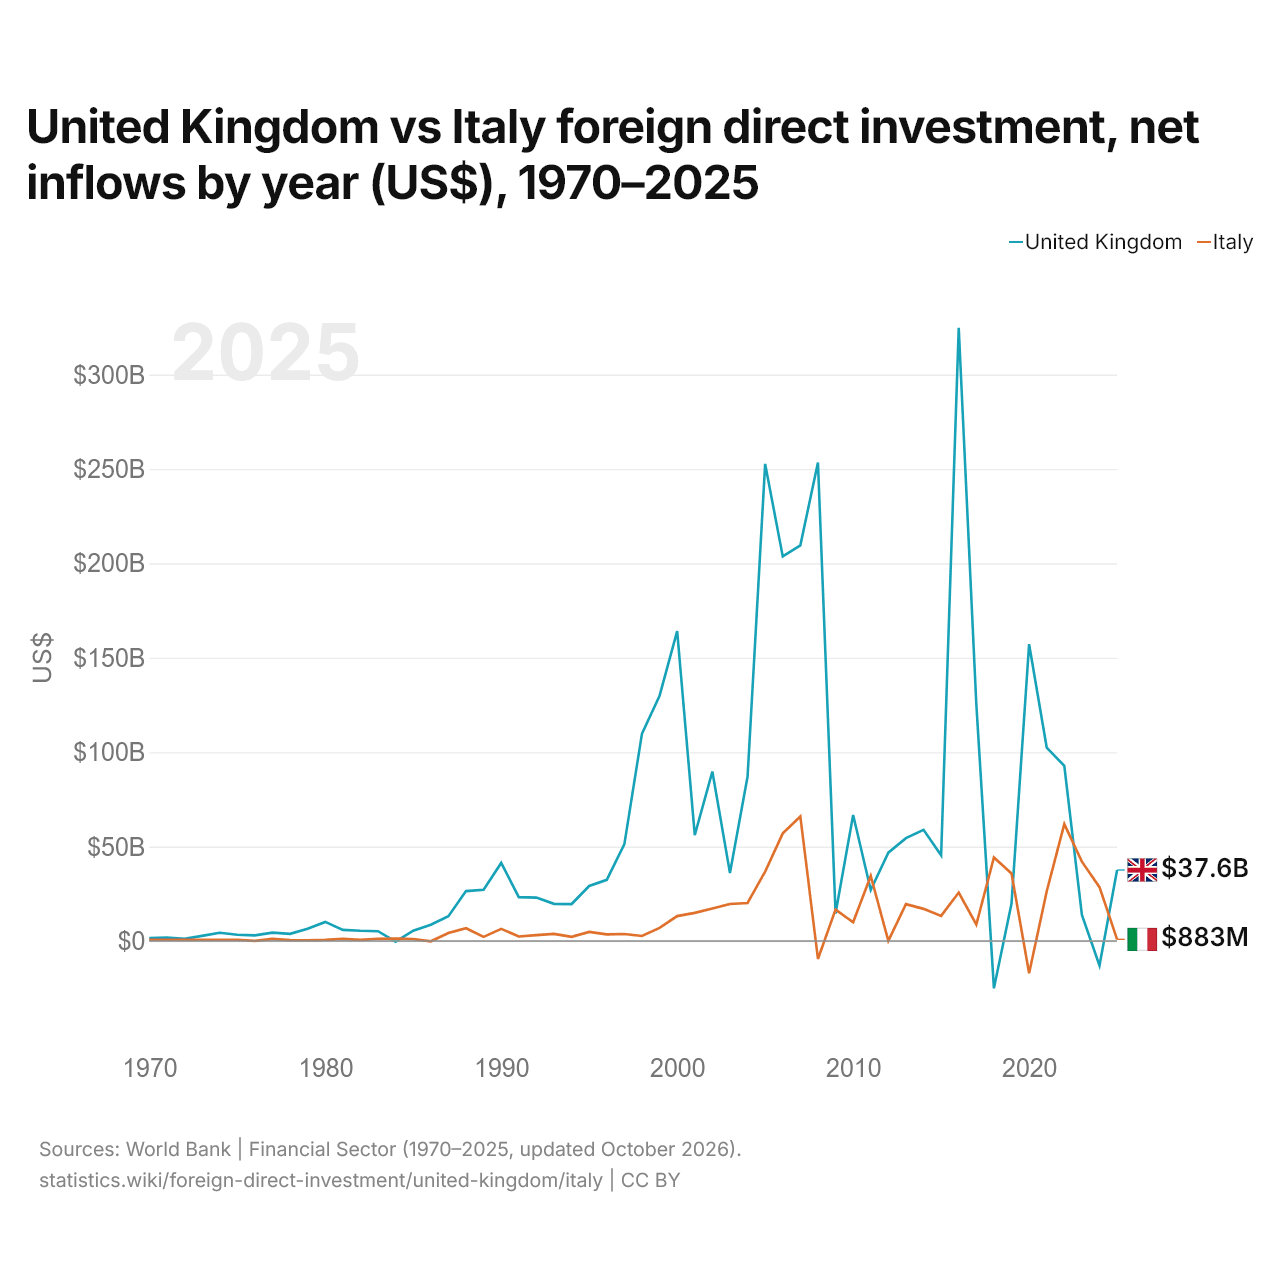
Royaume-Uni vs Italie : investissements directs étrangers, entrées nettes par année ($ US), 1970–2025
| Année | $ US | |
|---|---|---|
 Royaume-Uni |
 Italie |
|
| 2025 | 37 588 831 511 $ US | 882 914 836 $ US |
| 2024 | −12 955 141 485 $ US | 28 511 444 638 $ US |
| 2023 | 13 789 803 776 $ US | 42 019 753 074 $ US |
| 2022 | 92 776 358 059 $ US | 61 897 757 338 $ US |
| 2021 | 102 431 564 639 $ US | 26 253 856 510 $ US |
| 2020 | 157 185 559 300 $ US | −17 050 399 621 $ US |
| 2019 | 19 790 761 929 $ US | 35 760 550 299 $ US |
| 2018 | −25 055 440 307 $ US | 44 249 715 319 $ US |
| 2017 | 125 358 809 934 $ US | 8 737 024 579 $ US |
| 2016 | 324 813 224 213 $ US | 25 656 663 795 $ US |
| 2015 | 45 333 483 122 $ US | 13 303 439 230 $ US |
| 2014 | 58 890 445 253 $ US | 17 032 744 039 $ US |
| 2013 | 54 473 175 400 $ US | 19 531 411 962 $ US |
| 2012 | 46 750 789 728 $ US | 34 901 033 $ US |
| 2011 | 27 012 050 072 $ US | 34 465 481 830 $ US |
| 2010 | 66 734 551 294 $ US | 9 930 501 391 $ US |
| 2009 | 14 547 108 445 $ US | 16 607 196 345 $ US |
| 2008 | 253 454 117 907 $ US | −9 501 579 210 $ US |
| 2007 | 209 514 959 647 $ US | 65 975 535 145 $ US |
| 2006 | 203 636 431 868 $ US | 56 995 485 107 $ US |
| 2005 | 252 653 397 148 $ US | 36 762 073 075 $ US |
| 2004 | 87 059 621 382 $ US | 20 100 742 902 $ US |
| 2003 | 36 011 240 473 $ US | 19 572 886 734 $ US |
| 2002 | 89 760 582 753 $ US | 17 239 360 005 $ US |
| 2001 | 56 090 924 809 $ US | 14 878 086 499 $ US |
| 2000 | 164 130 335 444 $ US | 13 172 981 900 $ US |
| 1999 | 129 891 584 490 $ US | 6 941 768 225 $ US |
| 1998 | 109 817 612 847 $ US | 2 640 065 101 $ US |
| 1997 | 51 311 836 384 $ US | 3 687 266 506 $ US |
| 1996 | 32 412 668 835 $ US | 3 548 937 154 $ US |
| 1995 | 29 129 258 041 $ US | 4 843 882 770 $ US |
| 1994 | 19 561 337 402 $ US | 2 208 555 823 $ US |
| 1993 | 19 686 257 927 $ US | 3 738 910 088 $ US |
| 1992 | 23 011 210 834 $ US | 3 118 551 015 $ US |
| 1991 | 23 244 186 242 $ US | 2 403 349 144 $ US |
| 1990 | 41 363 405 439 $ US | 6 440 765 876 $ US |
| 1989 | 27 108 240 789 $ US | 2 191 462 724 $ US |
| 1988 | 26 430 921 298 $ US | 6 789 447 589 $ US |
| 1987 | 13 074 923 702 $ US | 4 188 118 187 $ US |
| 1986 | 8 569 621 722 $ US | −153 004 673 $ US |
| 1985 | 5 476 472 897 $ US | 1 066 817 196 $ US |
| 1984 | −347 322 545 $ US | 1 313 182 672 $ US |
| 1983 | 5 178 781 726 $ US | 1 194 907 475 $ US |
| 1982 | 5 413 259 759 $ US | 615 183 541 $ US |
| 1981 | 5 879 375 698 $ US | 1 124 409 633 $ US |
| 1980 | 10 122 844 316 $ US | 578 156 245 $ US |
| 1979 | 6 469 481 160 $ US | 415 373 573 $ US |
| 1978 | 3 787 370 849 $ US | 477 670 645 $ US |
| 1977 | 4 426 545 754 $ US | 1 129 034 015 $ US |
| 1976 | 3 006 207 709 $ US | 109 235 548 $ US |
| 1975 | 3 318 535 790 $ US | 644 515 568 $ US |
| 1974 | 4 373 743 380 $ US | 595 350 461 $ US |
| 1973 | 2 722 732 320 $ US | 673 103 003 $ US |
| 1972 | 1 207 963 191 $ US | 673 181 132 $ US |
| 1971 | 1 771 224 349 $ US | 549 089 965 $ US |
| 1970 | 1 487 998 812 $ US | 624 159 999 $ US |
En 2025, les entrées nettes d'investissements directs étrangers étaient de 37,6 milliards de dollars au Royaume-Uni et de 883 millions de dollars en Italie : 43 fois plus au Royaume-Uni. En 1970, elles étaient de 1,49 milliard de dollars au Royaume-Uni et de 624 millions de dollars en Italie.
Les entrées nettes d'investissements directs étrangers au Royaume-Uni ont été supérieures à celles de l'Italie pendant 49 des 56 années de 1970 à 2025, et inférieures pendant 7.
Royaume-Uni vs Italie : dernières entrées et sorties d'investissements étrangers
|
Royaume-Uni
|
Italie
|
|
|---|---|---|
| Entrées nettes | +37,6 Md $US | +883 M $US |
| Entrées nettes, % du PIB | +0,9 % | +0,0 % |
| Sorties nettes | +9,43 Md $US | +22,9 Md $US |
| Entrées nettes, total 2016–2025 | +836 Md $US | +257 Md $US |
| Rang mondial | 13/192 | 97/192 |
Comparer les investissements directs étrangers de 2 pays au choix
Sources :
- Banque mondiale | Secteur financier (1970–2025, mis à jour en octobre 2026)
Creative Commons Attribution (CC BY) : vous pouvez copier, partager, adapter et réutiliser ce contenu, y compris à des fins commerciales, à condition de citer statistics.wiki et d’indiquer les modifications apportées. Les sources citées ci-dessus peuvent avoir leurs propres conditions de licence.