
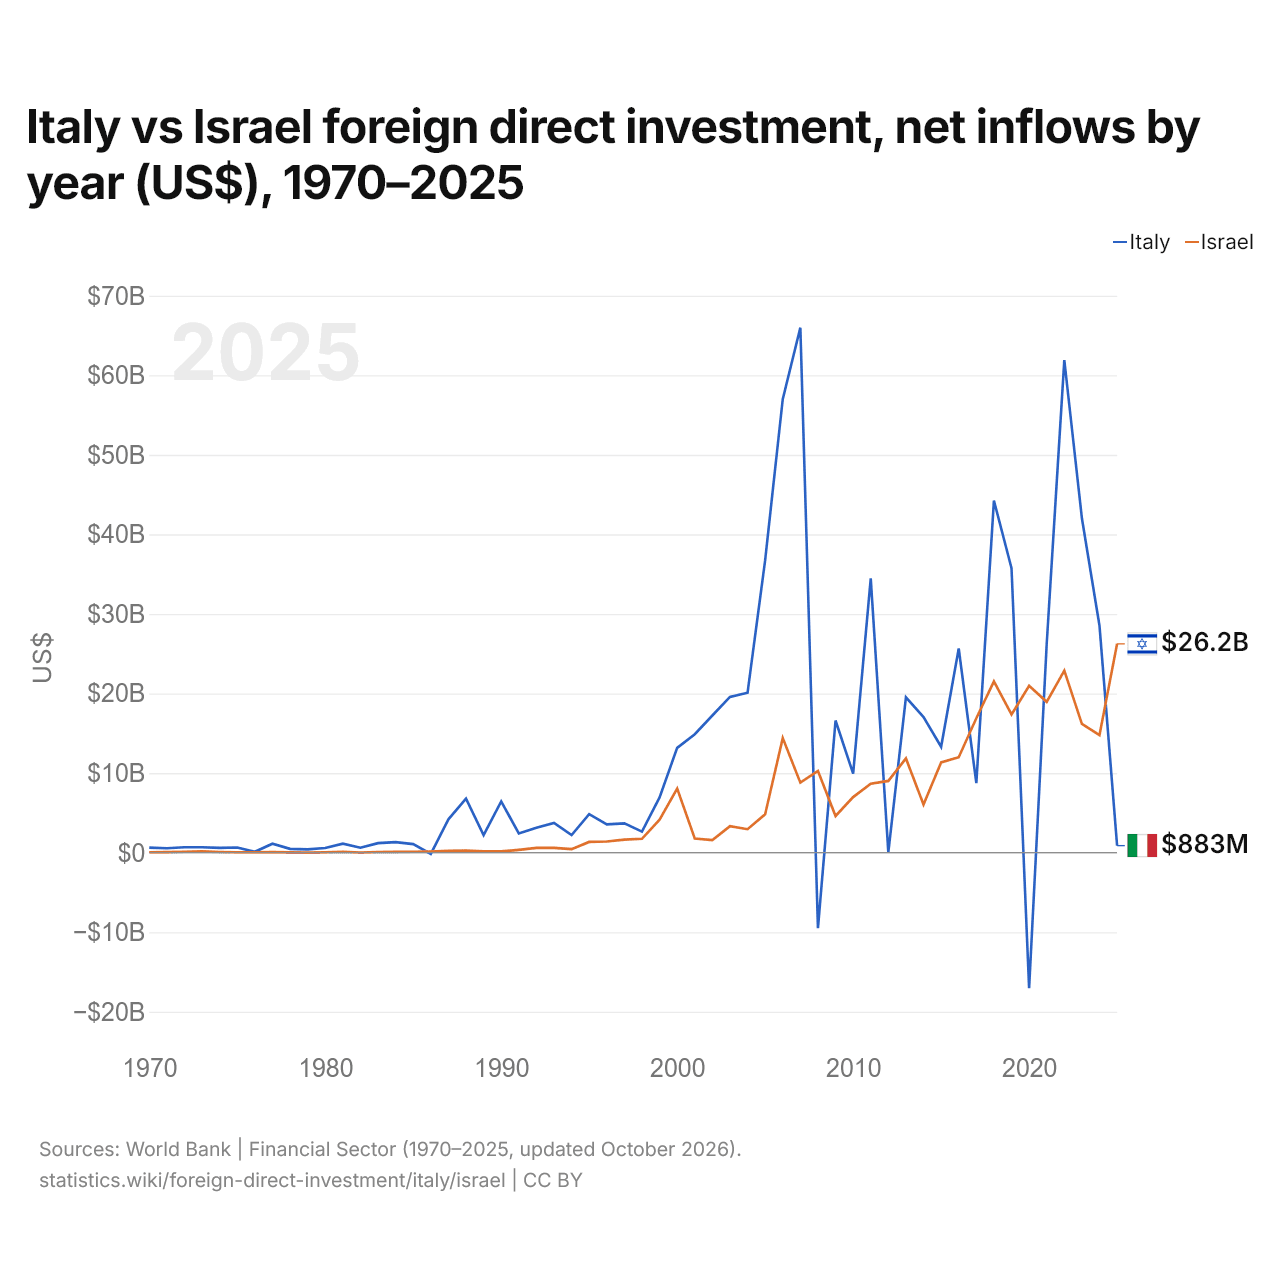
Italie vs Israël : investissements directs étrangers, entrées nettes par année ($ US), 1970–2025
| Année | $ US | |
|---|---|---|
 Italie |
 Israël |
|
| 2025 | 882 914 836 $ US | 26 242 100 000 $ US |
| 2024 | 28 511 444 638 $ US | 14 777 900 000 $ US |
| 2023 | 42 019 753 074 $ US | 16 170 300 000 $ US |
| 2022 | 61 897 757 338 $ US | 22 883 500 000 $ US |
| 2021 | 26 253 856 510 $ US | 18 949 900 000 $ US |
| 2020 | −17 050 399 621 $ US | 20 968 700 000 $ US |
| 2019 | 35 760 550 299 $ US | 17 362 500 000 $ US |
| 2018 | 44 249 715 319 $ US | 21 514 500 000 $ US |
| 2017 | 8 737 024 579 $ US | 16 892 500 000 $ US |
| 2016 | 25 656 663 795 $ US | 11 988 000 000 $ US |
| 2015 | 13 303 439 230 $ US | 11 336 200 000 $ US |
| 2014 | 17 032 744 039 $ US | 6 048 900 000 $ US |
| 2013 | 19 531 411 962 $ US | 11 842 200 000 $ US |
| 2012 | 34 901 033 $ US | 9 017 300 000 $ US |
| 2011 | 34 465 481 830 $ US | 8 653 000 000 $ US |
| 2010 | 9 930 501 391 $ US | 6 984 700 000 $ US |
| 2009 | 16 607 196 345 $ US | 4 606 900 000 $ US |
| 2008 | −9 501 579 210 $ US | 10 274 200 000 $ US |
| 2007 | 65 975 535 145 $ US | 8 798 100 000 $ US |
| 2006 | 56 995 485 107 $ US | 14 395 500 000 $ US |
| 2005 | 36 762 073 075 $ US | 4 818 400 000 $ US |
| 2004 | 20 100 742 902 $ US | 2 946 900 000 $ US |
| 2003 | 19 572 886 734 $ US | 3 322 000 000 $ US |
| 2002 | 17 239 360 005 $ US | 1 582 500 000 $ US |
| 2001 | 14 878 086 499 $ US | 1 771 300 000 $ US |
| 2000 | 13 172 981 900 $ US | 8 047 500 000 $ US |
| 1999 | 6 941 768 225 $ US | 4 150 000 000 $ US |
| 1998 | 2 640 065 101 $ US | 1 737 400 000 $ US |
| 1997 | 3 687 266 506 $ US | 1 633 800 000 $ US |
| 1996 | 3 548 937 154 $ US | 1 397 100 000 $ US |
| 1995 | 4 843 882 770 $ US | 1 350 300 000 $ US |
| 1994 | 2 208 555 823 $ US | 441 600 000 $ US |
| 1993 | 3 738 910 088 $ US | 604 900 000 $ US |
| 1992 | 3 118 551 015 $ US | 588 500 000 $ US |
| 1991 | 2 403 349 144 $ US | 345 600 000 $ US |
| 1990 | 6 440 765 876 $ US | 151 000 000 $ US |
| 1989 | 2 191 462 724 $ US | 160 400 000 $ US |
| 1988 | 6 789 447 589 $ US | 267 200 000 $ US |
| 1987 | 4 188 118 187 $ US | 224 100 000 $ US |
| 1986 | −153 004 673 $ US | 143 400 000 $ US |
| 1985 | 1 066 817 196 $ US | 112 300 000 $ US |
| 1984 | 1 313 182 672 $ US | 89 500 000 $ US |
| 1983 | 1 194 907 475 $ US | 78 500 000 $ US |
| 1982 | 615 183 541 $ US | 21 300 000 $ US |
| 1981 | 1 124 409 633 $ US | 114 400 000 $ US |
| 1980 | 578 156 245 $ US | 51 000 000 $ US |
| 1979 | 415 373 573 $ US | 11 000 000 $ US |
| 1978 | 477 670 645 $ US | 39 000 000 $ US |
| 1977 | 1 129 034 015 $ US | 81 000 000 $ US |
| 1976 | 109 235 548 $ US | 47 000 000 $ US |
| 1975 | 644 515 568 $ US | 45 000 000 $ US |
| 1974 | 595 350 461 $ US | 84 000 000 $ US |
| 1973 | 673 103 003 $ US | 149 000 000 $ US |
| 1972 | 673 181 132 $ US | 114 000 000 $ US |
| 1971 | 549 089 965 $ US | 57 000 000 $ US |
| 1970 | 624 159 999 $ US | 49 000 000 $ US |
En 2025, les entrées nettes d'investissements directs étrangers étaient de 883 millions de dollars en Italie et de 26,2 milliards de dollars en Israël : 30 fois plus en Israël. En 1970, elles étaient de 624 millions de dollars en Italie et de 49 millions de dollars en Israël.
Les entrées nettes d'investissements directs étrangers en Italie ont été supérieures à celles d'Israël pendant 50 des 56 années de 1970 à 2025, et inférieures pendant 6.
Italie vs Israël : dernières entrées et sorties d'investissements étrangers
|
Italie
|
Israël
|
|
|---|---|---|
| Entrées nettes | +883 M $US | +26,2 Md $US |
| Entrées nettes, % du PIB | +0,0 % | +4,3 % |
| Sorties nettes | +22,9 Md $US | +14,7 Md $US |
| Entrées nettes, total 2016–2025 | +257 Md $US | +188 Md $US |
| Rang mondial | 97/192 | 18/192 |
Comparer les investissements directs étrangers de 2 pays au choix
Sources :
- Banque mondiale | Secteur financier (1970–2025, mis à jour en octobre 2026)
Creative Commons Attribution (CC BY) : vous pouvez copier, partager, adapter et réutiliser ce contenu, y compris à des fins commerciales, à condition de citer statistics.wiki et d’indiquer les modifications apportées. Les sources citées ci-dessus peuvent avoir leurs propres conditions de licence.