
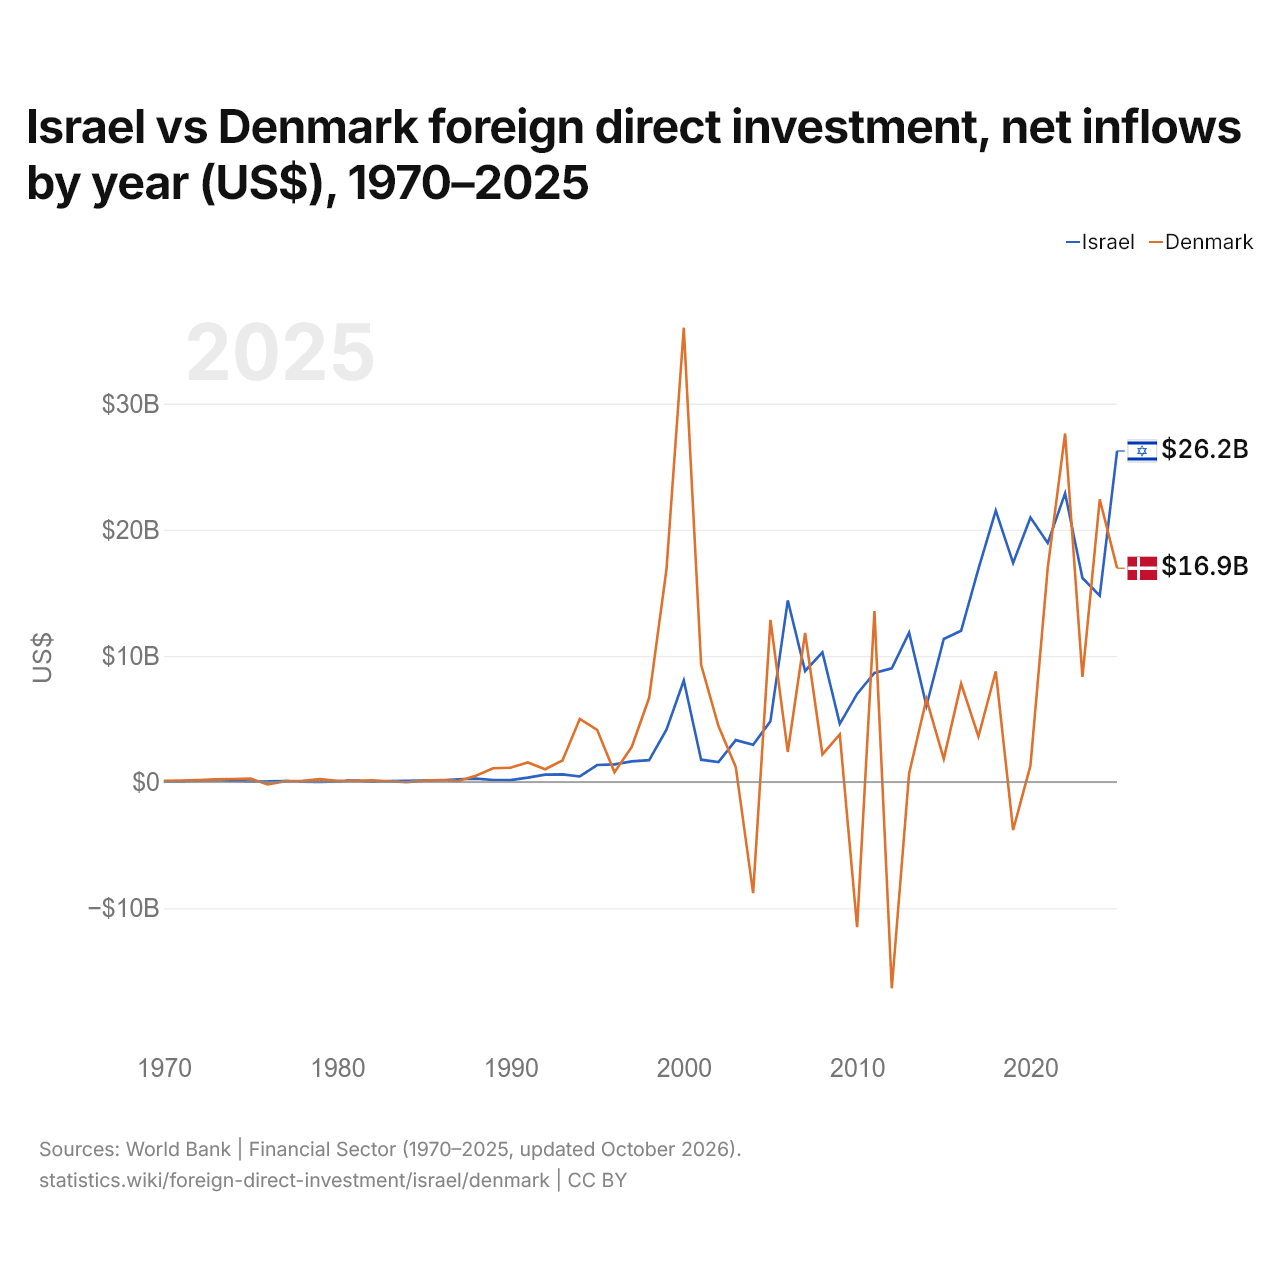
Israël vs Danemark : investissements directs étrangers, entrées nettes par année ($ US), 1970–2025
| Année | $ US | |
|---|---|---|
 Israël |
 Danemark |
|
| 2025 | 26 242 100 000 $ US | 16 949 298 439 $ US |
| 2024 | 14 777 900 000 $ US | 22 409 478 779 $ US |
| 2023 | 16 170 300 000 $ US | 8 339 457 436 $ US |
| 2022 | 22 883 500 000 $ US | 27 627 359 889 $ US |
| 2021 | 18 949 900 000 $ US | 16 997 286 703 $ US |
| 2020 | 20 968 700 000 $ US | 1 294 050 740 $ US |
| 2019 | 17 362 500 000 $ US | −3 801 733 789 $ US |
| 2018 | 21 514 500 000 $ US | 8 764 023 726 $ US |
| 2017 | 16 892 500 000 $ US | 3 607 276 300 $ US |
| 2016 | 11 988 000 000 $ US | 7 804 020 827 $ US |
| 2015 | 11 336 200 000 $ US | 1 842 994 663 $ US |
| 2014 | 6 048 900 000 $ US | 6 577 348 987 $ US |
| 2013 | 11 842 200 000 $ US | 680 338 946 $ US |
| 2012 | 9 017 300 000 $ US | −16 349 825 685 $ US |
| 2011 | 8 653 000 000 $ US | 13 558 894 634 $ US |
| 2010 | 6 984 700 000 $ US | −11 501 101 751 $ US |
| 2009 | 4 606 900 000 $ US | 3 779 250 819 $ US |
| 2008 | 10 274 200 000 $ US | 2 191 215 666 $ US |
| 2007 | 8 798 100 000 $ US | 11 809 448 518 $ US |
| 2006 | 14 395 500 000 $ US | 2 385 249 288 $ US |
| 2005 | 4 818 400 000 $ US | 12 847 031 342 $ US |
| 2004 | 2 946 900 000 $ US | −8 804 165 491 $ US |
| 2003 | 3 322 000 000 $ US | 1 184 825 160 $ US |
| 2002 | 1 582 500 000 $ US | 4 430 703 179 $ US |
| 2001 | 1 771 300 000 $ US | 9 286 404 806 $ US |
| 2000 | 8 047 500 000 $ US | 36 013 297 907 $ US |
| 1999 | 4 150 000 000 $ US | 16 847 919 226 $ US |
| 1998 | 1 737 400 000 $ US | 6 674 661 469 $ US |
| 1997 | 1 633 800 000 $ US | 2 791 671 359 $ US |
| 1996 | 1 397 100 000 $ US | 773 444 116 $ US |
| 1995 | 1 350 300 000 $ US | 4 139 423 320 $ US |
| 1994 | 441 600 000 $ US | 5 006 178 362 $ US |
| 1993 | 604 900 000 $ US | 1 712 766 178 $ US |
| 1992 | 588 500 000 $ US | 1 017 385 349 $ US |
| 1991 | 345 600 000 $ US | 1 552 515 351 $ US |
| 1990 | 151 000 000 $ US | 1 132 146 350 $ US |
| 1989 | 160 400 000 $ US | 1 089 565 260 $ US |
| 1988 | 267 200 000 $ US | 503 338 113 $ US |
| 1987 | 224 100 000 $ US | 84 660 817 $ US |
| 1986 | 143 400 000 $ US | 163 266 341 $ US |
| 1985 | 112 300 000 $ US | 111 103 418 $ US |
| 1984 | 89 500 000 $ US | −15 356 842 $ US |
| 1983 | 78 500 000 $ US | 60 130 800 $ US |
| 1982 | 21 300 000 $ US | 133 850 097 $ US |
| 1981 | 114 400 000 $ US | 99 454 250 $ US |
| 1980 | 51 000 000 $ US | 104 119 701 $ US |
| 1979 | 11 000 000 $ US | 223 893 245 $ US |
| 1978 | 39 000 000 $ US | 89 464 875 $ US |
| 1977 | 81 000 000 $ US | 75 799 729 $ US |
| 1976 | 47 000 000 $ US | −190 295 663 $ US |
| 1975 | 45 000 000 $ US | 266 942 015 $ US |
| 1974 | 84 000 000 $ US | 240 000 000 $ US |
| 1973 | 149 000 000 $ US | 212 000 000 $ US |
| 1972 | 114 000 000 $ US | 164 000 000 $ US |
| 1971 | 57 000 000 $ US | 125 000 000 $ US |
| 1970 | 49 000 000 $ US | 104 000 000 $ US |
En 2025, les entrées nettes d'investissements directs étrangers étaient de 26,2 milliards de dollars en Israël et de 16,9 milliards de dollars au Danemark : 1,5 fois plus en Israël. En 1970, elles étaient de 49 millions de dollars en Israël et de 104 millions de dollars au Danemark.
Les entrées nettes d'investissements directs étrangers en Israël ont été supérieures à celles du Danemark pendant 25 des 56 années de 1970 à 2025, et inférieures pendant 31.
Israël vs Danemark : dernières entrées et sorties d'investissements étrangers
|
Israël
|
Danemark
|
|
|---|---|---|
| Entrées nettes | +26,2 Md $US | +16,9 Md $US |
| Entrées nettes, % du PIB | +4,3 % | +3,7 % |
| Sorties nettes | +14,7 Md $US | +52,8 Md $US |
| Entrées nettes, total 2016–2025 | +188 Md $US | +110 Md $US |
| Rang mondial | 18/192 | 25/192 |
Comparer les investissements directs étrangers de 2 pays au choix
Sources :
- Banque mondiale | Secteur financier (1970–2025, mis à jour en octobre 2026)
Creative Commons Attribution (CC BY) : vous pouvez copier, partager, adapter et réutiliser ce contenu, y compris à des fins commerciales, à condition de citer statistics.wiki et d’indiquer les modifications apportées. Les sources citées ci-dessus peuvent avoir leurs propres conditions de licence.