
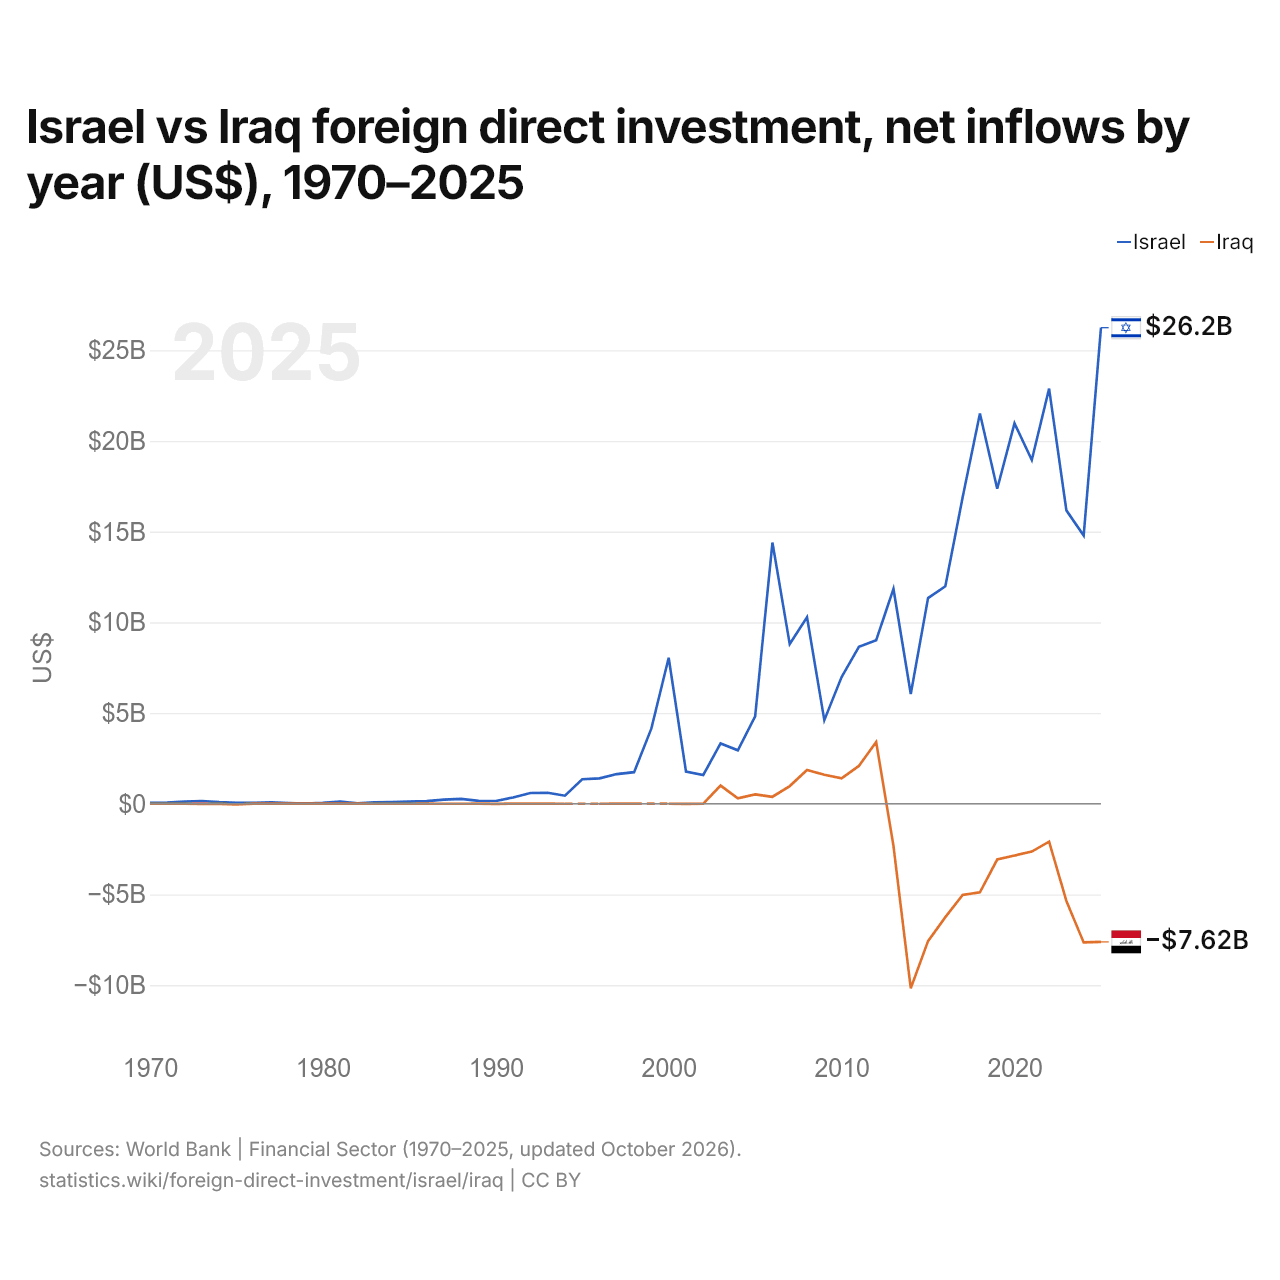
Israël vs Irak : investissements directs étrangers, entrées nettes par année ($ US), 1970–2025
| Année | $ US | |
|---|---|---|
 Israël |
 Irak |
|
| 2025 | 26 242 100 000 $ US | −7 618 200 000 $ US |
| 2024 | 14 777 900 000 $ US | −7 648 900 000 $ US |
| 2023 | 16 170 300 000 $ US | −5 363 500 000 $ US |
| 2022 | 22 883 500 000 $ US | −2 088 200 000 $ US |
| 2021 | 18 949 900 000 $ US | −2 637 300 000 $ US |
| 2020 | 20 968 700 000 $ US | −2 859 100 000 $ US |
| 2019 | 17 362 500 000 $ US | −3 075 600 000 $ US |
| 2018 | 21 514 500 000 $ US | −4 885 100 000 $ US |
| 2017 | 16 892 500 000 $ US | −5 032 400 000 $ US |
| 2016 | 11 988 000 000 $ US | −6 255 900 000 $ US |
| 2015 | 11 336 200 000 $ US | −7 574 200 000 $ US |
| 2014 | 6 048 900 000 $ US | −10 176 400 000 $ US |
| 2013 | 11 842 200 000 $ US | −2 335 300 000 $ US |
| 2012 | 9 017 300 000 $ US | 3 400 000 000 $ US |
| 2011 | 8 653 000 000 $ US | 2 082 000 000 $ US |
| 2010 | 6 984 700 000 $ US | 1 396 200 000 $ US |
| 2009 | 4 606 900 000 $ US | 1 598 300 000 $ US |
| 2008 | 10 274 200 000 $ US | 1 855 700 000 $ US |
| 2007 | 8 798 100 000 $ US | 971 800 000 $ US |
| 2006 | 14 395 500 000 $ US | 383 000 000 $ US |
| 2005 | 4 818 400 000 $ US | 515 300 000 $ US |
| 2004 | 2 946 900 000 $ US | 300 000 000 $ US |
| 2003 | 3 322 000 000 $ US | 1 000 000 000 $ US |
| 2002 | 1 582 500 000 $ US | −326 000 $ US |
| 2001 | 1 771 300 000 $ US | −6 656 000 $ US |
| 2000 | 8 047 500 000 $ US | −32 000 $ US |
| 1999 | 4 150 000 000 $ US | - |
| 1998 | 1 737 400 000 $ US | 7 388 000 $ US |
| 1997 | 1 633 800 000 $ US | 1 153 000 $ US |
| 1996 | 1 397 100 000 $ US | −1 994 000 $ US |
| 1995 | 1 350 300 000 $ US | - |
| 1994 | 441 600 000 $ US | −30 000 $ US |
| 1993 | 604 900 000 $ US | 803 000 $ US |
| 1992 | 588 500 000 $ US | 93 000 $ US |
| 1991 | 345 600 000 $ US | 7 686 000 $ US |
| 1990 | 151 000 000 $ US | −6 810 000 $ US |
| 1989 | 160 400 000 $ US | 390 000 $ US |
| 1988 | 267 200 000 $ US | −3 383 000 $ US |
| 1987 | 224 100 000 $ US | −4 291 000 $ US |
| 1986 | 143 400 000 $ US | 918 000 $ US |
| 1985 | 112 300 000 $ US | −1 160 000 $ US |
| 1984 | 89 500 000 $ US | −2 749 000 $ US |
| 1983 | 78 500 000 $ US | −234 000 $ US |
| 1982 | 21 300 000 $ US | 2 420 000 $ US |
| 1981 | 114 400 000 $ US | 4 120 000 $ US |
| 1980 | 51 000 000 $ US | 1 530 000 $ US |
| 1979 | 11 000 000 $ US | 1 610 000 $ US |
| 1978 | 39 000 000 $ US | 300 000 $ US |
| 1977 | 81 000 000 $ US | 4 390 000 $ US |
| 1976 | 47 000 000 $ US | 1 350 000 $ US |
| 1975 | 45 000 000 $ US | −44 920 000 $ US |
| 1974 | 84 000 000 $ US | −8 830 000 $ US |
| 1973 | 149 000 000 $ US | −6 550 000 $ US |
| 1972 | 114 000 000 $ US | −90 000 $ US |
| 1971 | 57 000 000 $ US | −180 000 $ US |
| 1970 | 49 000 000 $ US | −910 000 $ US |
En 2025, les entrées nettes d'investissements directs étrangers étaient de 26,2 milliards de dollars en Israël et négatives en Irak, 7,62 milliards de dollars. En 1970, elles étaient de 49 millions de dollars en Israël et négatives en Irak, 910 000 dollars.
Les entrées nettes d'investissements directs étrangers en Israël ont été supérieures à celles de l'Irak chacune des 54 années de 1970 à 2025 que les deux pays ont communiquées.
Israël vs Irak : dernières entrées et sorties d'investissements étrangers
|
Israël
|
Irak
|
|
|---|---|---|
| Entrées nettes | +26,2 Md $US | −7,62 Md $US |
| Entrées nettes, % du PIB | +4,3 % | −3,0 % |
| Sorties nettes | +14,7 Md $US | +422 M $US |
| Entrées nettes, total 2016–2025 | +188 Md $US | −47,5 Md $US |
| Rang mondial | 18/192 | 188/192 |
Comparer les investissements directs étrangers de 2 pays au choix
Sources :
- Banque mondiale | Secteur financier (1970–2025, mis à jour en octobre 2026)
Creative Commons Attribution (CC BY) : vous pouvez copier, partager, adapter et réutiliser ce contenu, y compris à des fins commerciales, à condition de citer statistics.wiki et d’indiquer les modifications apportées. Les sources citées ci-dessus peuvent avoir leurs propres conditions de licence.