
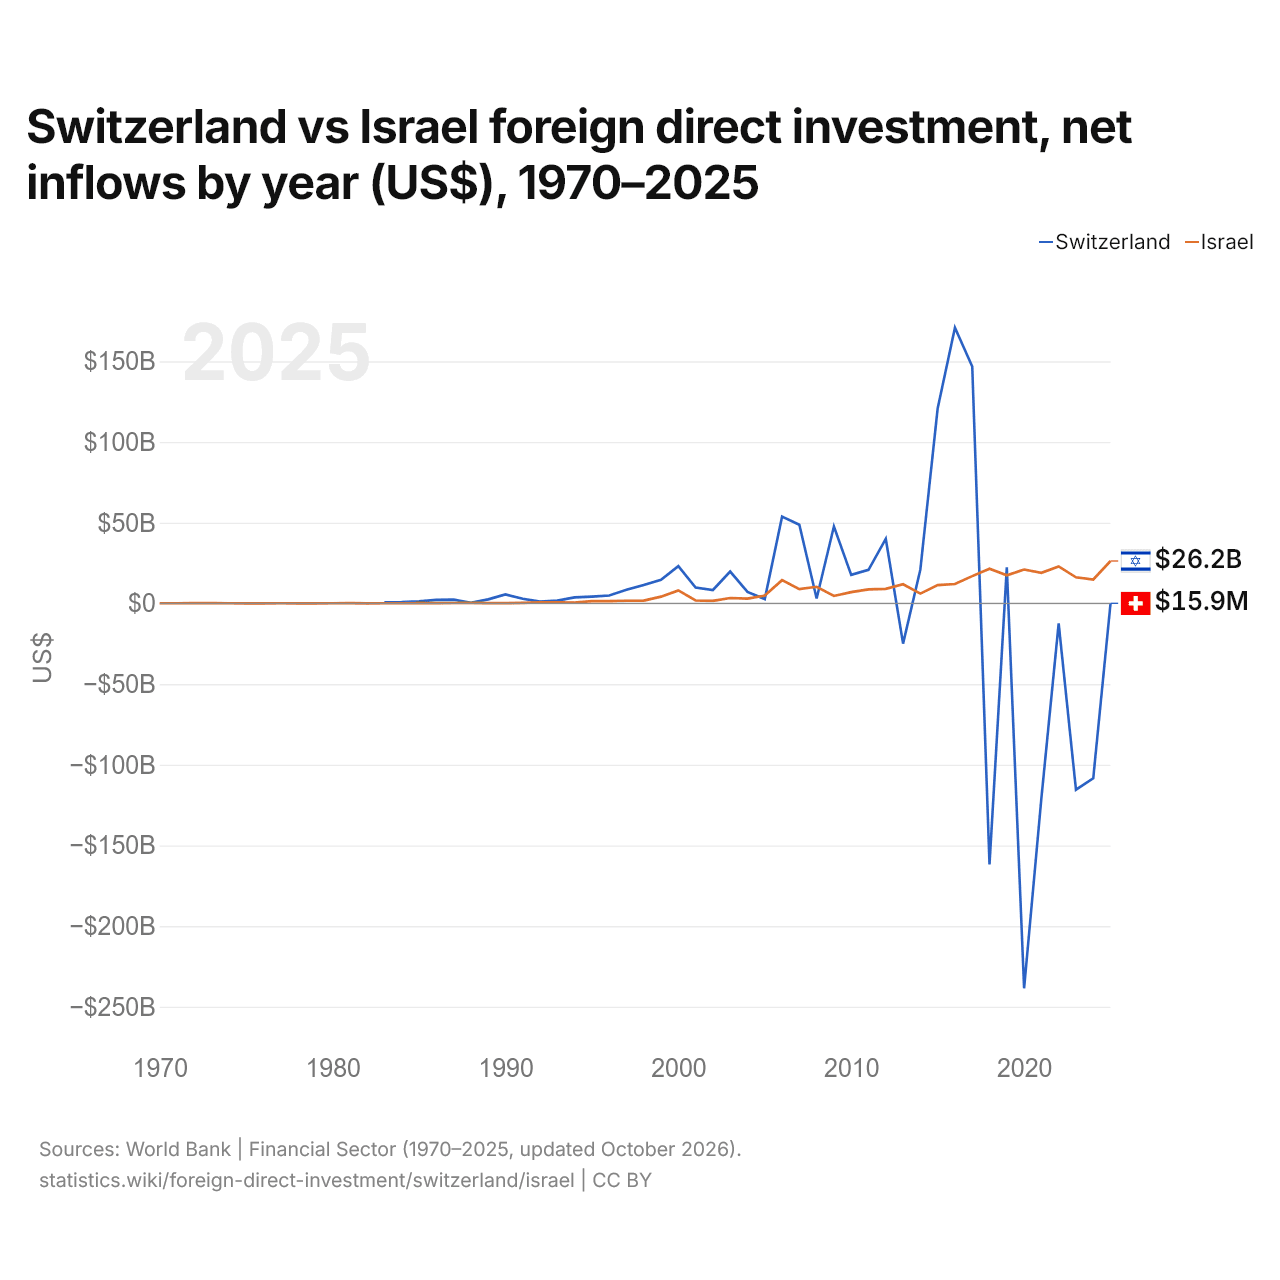
Suisse vs Israël : investissements directs étrangers, entrées nettes par année ($ US), 1970–2025
| Année | $ US | |
|---|---|---|
 Suisse |
 Israël |
|
| 2025 | 15 896 179 $ US | 26 242 100 000 $ US |
| 2024 | −108 395 568 634 $ US | 14 777 900 000 $ US |
| 2023 | −115 458 607 845 $ US | 16 170 300 000 $ US |
| 2022 | −12 414 047 155 $ US | 22 883 500 000 $ US |
| 2021 | −120 778 435 588 $ US | 18 949 900 000 $ US |
| 2020 | −238 563 810 400 $ US | 20 968 700 000 $ US |
| 2019 | 22 355 117 767 $ US | 17 362 500 000 $ US |
| 2018 | −161 796 242 279 $ US | 21 514 500 000 $ US |
| 2017 | 146 779 212 955 $ US | 16 892 500 000 $ US |
| 2016 | 170 848 654 801 $ US | 11 988 000 000 $ US |
| 2015 | 120 722 433 558 $ US | 11 336 200 000 $ US |
| 2014 | 21 003 091 522 $ US | 6 048 900 000 $ US |
| 2013 | −24 926 465 857 $ US | 11 842 200 000 $ US |
| 2012 | 39 943 494 322 $ US | 9 017 300 000 $ US |
| 2011 | 20 764 483 835 $ US | 8 653 000 000 $ US |
| 2010 | 17 670 735 603 $ US | 6 984 700 000 $ US |
| 2009 | 47 658 570 355 $ US | 4 606 900 000 $ US |
| 2008 | 2 990 936 685 $ US | 10 274 200 000 $ US |
| 2007 | 48 688 296 543 $ US | 8 798 100 000 $ US |
| 2006 | 53 760 772 986 $ US | 14 395 500 000 $ US |
| 2005 | 2 664 910 821 $ US | 4 818 400 000 $ US |
| 2004 | 7 102 294 153 $ US | 2 946 900 000 $ US |
| 2003 | 19 721 053 893 $ US | 3 322 000 000 $ US |
| 2002 | 8 258 050 580 $ US | 1 582 500 000 $ US |
| 2001 | 9 765 012 889 $ US | 1 771 300 000 $ US |
| 2000 | 23 080 879 763 $ US | 8 047 500 000 $ US |
| 1999 | 14 541 329 308 $ US | 4 150 000 000 $ US |
| 1998 | 11 345 529 735 $ US | 1 737 400 000 $ US |
| 1997 | 8 391 921 106 $ US | 1 633 800 000 $ US |
| 1996 | 4 880 219 416 $ US | 1 397 100 000 $ US |
| 1995 | 4 158 247 960 $ US | 1 350 300 000 $ US |
| 1994 | 3 682 699 145 $ US | 441 600 000 $ US |
| 1993 | 1 706 937 974 $ US | 604 900 000 $ US |
| 1992 | 1 128 487 634 $ US | 588 500 000 $ US |
| 1991 | 2 838 789 161 $ US | 345 600 000 $ US |
| 1990 | 5 544 796 310 $ US | 151 000 000 $ US |
| 1989 | 2 497 180 494 $ US | 160 400 000 $ US |
| 1988 | 405 248 411 $ US | 267 200 000 $ US |
| 1987 | 2 320 291 937 $ US | 224 100 000 $ US |
| 1986 | 2 122 388 475 $ US | 143 400 000 $ US |
| 1985 | 1 267 334 792 $ US | 112 300 000 $ US |
| 1984 | 777 125 996 $ US | 89 500 000 $ US |
| 1983 | 642 643 620 $ US | 78 500 000 $ US |
| 1982 | - | 21 300 000 $ US |
| 1981 | - | 114 400 000 $ US |
| 1980 | - | 51 000 000 $ US |
| 1979 | - | 11 000 000 $ US |
| 1978 | - | 39 000 000 $ US |
| 1977 | - | 81 000 000 $ US |
| 1976 | - | 47 000 000 $ US |
| 1975 | - | 45 000 000 $ US |
| 1974 | - | 84 000 000 $ US |
| 1973 | - | 149 000 000 $ US |
| 1972 | - | 114 000 000 $ US |
| 1971 | - | 57 000 000 $ US |
| 1970 | - | 49 000 000 $ US |
En 2025, les entrées nettes d'investissements directs étrangers étaient de 15,9 millions de dollars en Suisse et de 26,2 milliards de dollars en Israël : 1 700 fois plus en Israël. En 1983, elles étaient de 643 millions de dollars en Suisse et de 78,5 millions de dollars en Israël.
Les entrées nettes d'investissements directs étrangers en Suisse ont été supérieures à celles d'Israël pendant 33 des 43 années de 1983 à 2025, et inférieures pendant 10.
Suisse vs Israël : dernières entrées et sorties d'investissements étrangers
|
Suisse
|
Israël
|
|
|---|---|---|
| Entrées nettes | +15,9 M $US | +26,2 Md $US |
| Entrées nettes, % du PIB | +0,0 % | +4,3 % |
| Sorties nettes | +32,3 Md $US | +14,7 Md $US |
| Entrées nettes, total 2016–2025 | −417 Md $US | +188 Md $US |
| Rang mondial | 165/192 | 18/192 |
Comparer les investissements directs étrangers de 2 pays au choix
Sources :
- Banque mondiale | Secteur financier (1970–2025, mis à jour en octobre 2026)
Creative Commons Attribution (CC BY) : vous pouvez copier, partager, adapter et réutiliser ce contenu, y compris à des fins commerciales, à condition de citer statistics.wiki et d’indiquer les modifications apportées. Les sources citées ci-dessus peuvent avoir leurs propres conditions de licence.