
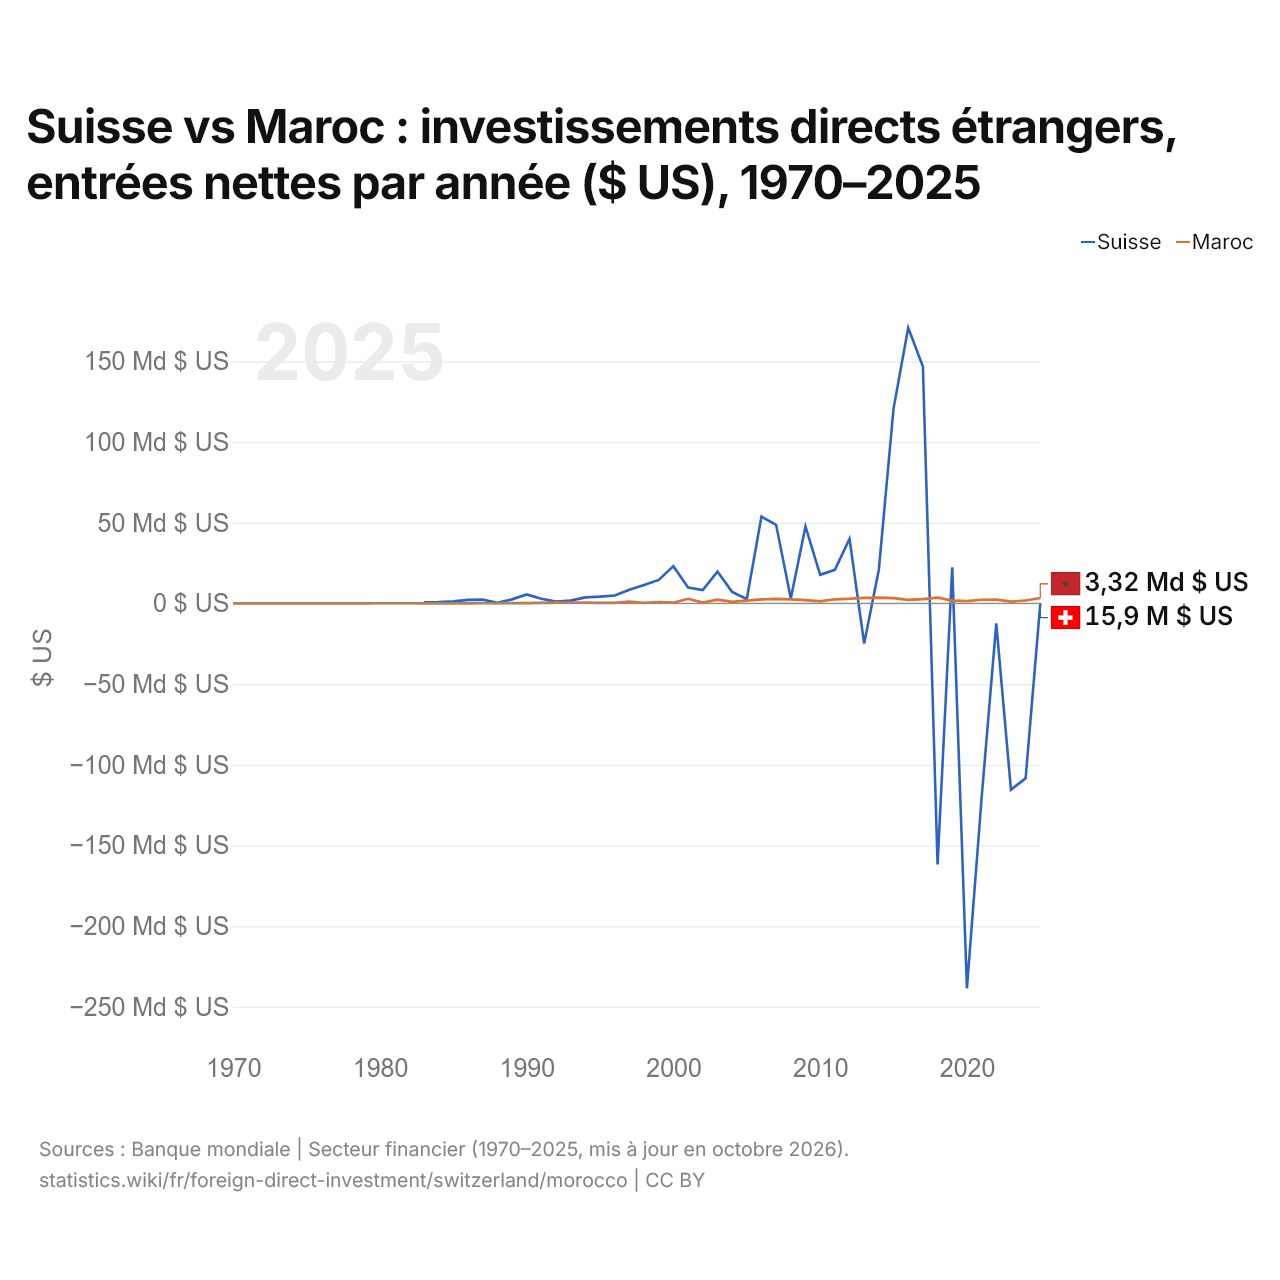
Suisse vs Maroc : investissements directs étrangers, entrées nettes par année ($ US), 1970–2025
| Année | $ US | |
|---|---|---|
 Suisse |
 Maroc |
|
| 2025 | 15 896 179 $ US | 3 318 381 812 $ US |
| 2024 | −108 395 568 634 $ US | 1 748 257 754 $ US |
| 2023 | −115 458 607 845 $ US | 1 060 023 610 $ US |
| 2022 | −12 414 047 155 $ US | 2 294 356 059 $ US |
| 2021 | −120 778 435 588 $ US | 2 264 148 625 $ US |
| 2020 | −238 563 810 400 $ US | 1 418 713 119 $ US |
| 2019 | 22 355 117 767 $ US | 1 720 825 003 $ US |
| 2018 | −161 796 242 279 $ US | 3 544 387 229 $ US |
| 2017 | 146 779 212 955 $ US | 2 680 109 856 $ US |
| 2016 | 170 848 654 801 $ US | 2 153 363 905 $ US |
| 2015 | 120 722 433 558 $ US | 3 252 913 902 $ US |
| 2014 | 21 003 091 522 $ US | 3 525 384 612 $ US |
| 2013 | −24 926 465 857 $ US | 3 360 909 924 $ US |
| 2012 | 39 943 494 322 $ US | 2 841 954 371 $ US |
| 2011 | 20 764 483 835 $ US | 2 521 362 081 $ US |
| 2010 | 17 670 735 603 $ US | 1 240 625 859 $ US |
| 2009 | 47 658 570 355 $ US | 1 970 323 920 $ US |
| 2008 | 2 990 936 685 $ US | 2 466 288 357 $ US |
| 2007 | 48 688 296 543 $ US | 2 825 801 376 $ US |
| 2006 | 53 760 772 986 $ US | 2 460 787 164 $ US |
| 2005 | 2 664 910 821 $ US | 1 670 609 689 $ US |
| 2004 | 7 102 294 153 $ US | 893 325 393 $ US |
| 2003 | 19 721 053 893 $ US | 2 312 829 823 $ US |
| 2002 | 8 258 050 580 $ US | 480 355 698 $ US |
| 2001 | 9 765 012 889 $ US | 2 824 557 252 $ US |
| 2000 | 23 080 879 763 $ US | 426 553 284 $ US |
| 1999 | 14 541 329 308 $ US | 826 974 027 $ US |
| 1998 | 11 345 529 735 $ US | 308 712 164 $ US |
| 1997 | 8 391 921 106 $ US | 1 079 341 332 $ US |
| 1996 | 4 880 219 416 $ US | 357 393 802 $ US |
| 1995 | 4 158 247 960 $ US | 334 768 273 $ US |
| 1994 | 3 682 699 145 $ US | 550 924 374 $ US |
| 1993 | 1 706 937 974 $ US | 491 466 065 $ US |
| 1992 | 1 128 487 634 $ US | 422 470 462 $ US |
| 1991 | 2 838 789 161 $ US | 317 462 141 $ US |
| 1990 | 5 544 796 310 $ US | 165 122 978 $ US |
| 1989 | 2 497 180 494 $ US | 167 056 032 $ US |
| 1988 | 405 248 411 $ US | 84 661 628 $ US |
| 1987 | 2 320 291 937 $ US | 59 574 901 $ US |
| 1986 | 2 122 388 475 $ US | 549 182 $ US |
| 1985 | 1 267 334 792 $ US | 19 975 167 $ US |
| 1984 | 777 125 996 $ US | 46 989 197 $ US |
| 1983 | 642 643 620 $ US | 46 123 624 $ US |
| 1982 | - | 79 528 177 $ US |
| 1981 | - | 58 581 336 $ US |
| 1980 | - | 89 416 223 $ US |
| 1979 | - | 7 437 549 $ US |
| 1978 | - | 11 759 988 $ US |
| 1977 | - | 7 994 056 $ US |
| 1976 | - | 38 014 963 $ US |
| 1975 | - | 5 020 000 $ US |
| 1974 | - | −20 400 000 $ US |
| 1973 | - | 5 490 000 $ US |
| 1972 | - | 13 000 000 $ US |
| 1971 | - | 23 100 000 $ US |
| 1970 | - | 20 000 000 $ US |
En 2025, les entrées nettes d'investissements directs étrangers étaient de 15,9 millions de dollars en Suisse et de 3,32 milliards de dollars au Maroc : 210 fois plus au Maroc. En 1983, elles étaient de 643 millions de dollars en Suisse et de 46,1 millions de dollars au Maroc.
Les entrées nettes d'investissements directs étrangers en Suisse ont été supérieures à celles du Maroc pendant 35 des 43 années de 1983 à 2025, et inférieures pendant 8.
Suisse vs Maroc : dernières entrées et sorties d'investissements étrangers
|
Suisse
|
Maroc
|
|
|---|---|---|
| Entrées nettes | +15,9 M $US | +3,32 Md $US |
| Entrées nettes, % du PIB | +0,0 % | +1,8 % |
| Sorties nettes | +32,3 Md $US | +812 M $US |
| Entrées nettes, total 2016–2025 | −417 Md $US | +22,2 Md $US |
| Rang mondial | 165/192 | 56/192 |
Comparer les investissements directs étrangers de 2 pays au choix
Sources :
- Banque mondiale | Secteur financier (1970–2025, mis à jour en octobre 2026)
Creative Commons Attribution (CC BY) : vous pouvez copier, partager, adapter et réutiliser ce contenu, y compris à des fins commerciales, à condition de citer statistics.wiki et d’indiquer les modifications apportées. Les sources citées ci-dessus peuvent avoir leurs propres conditions de licence.