
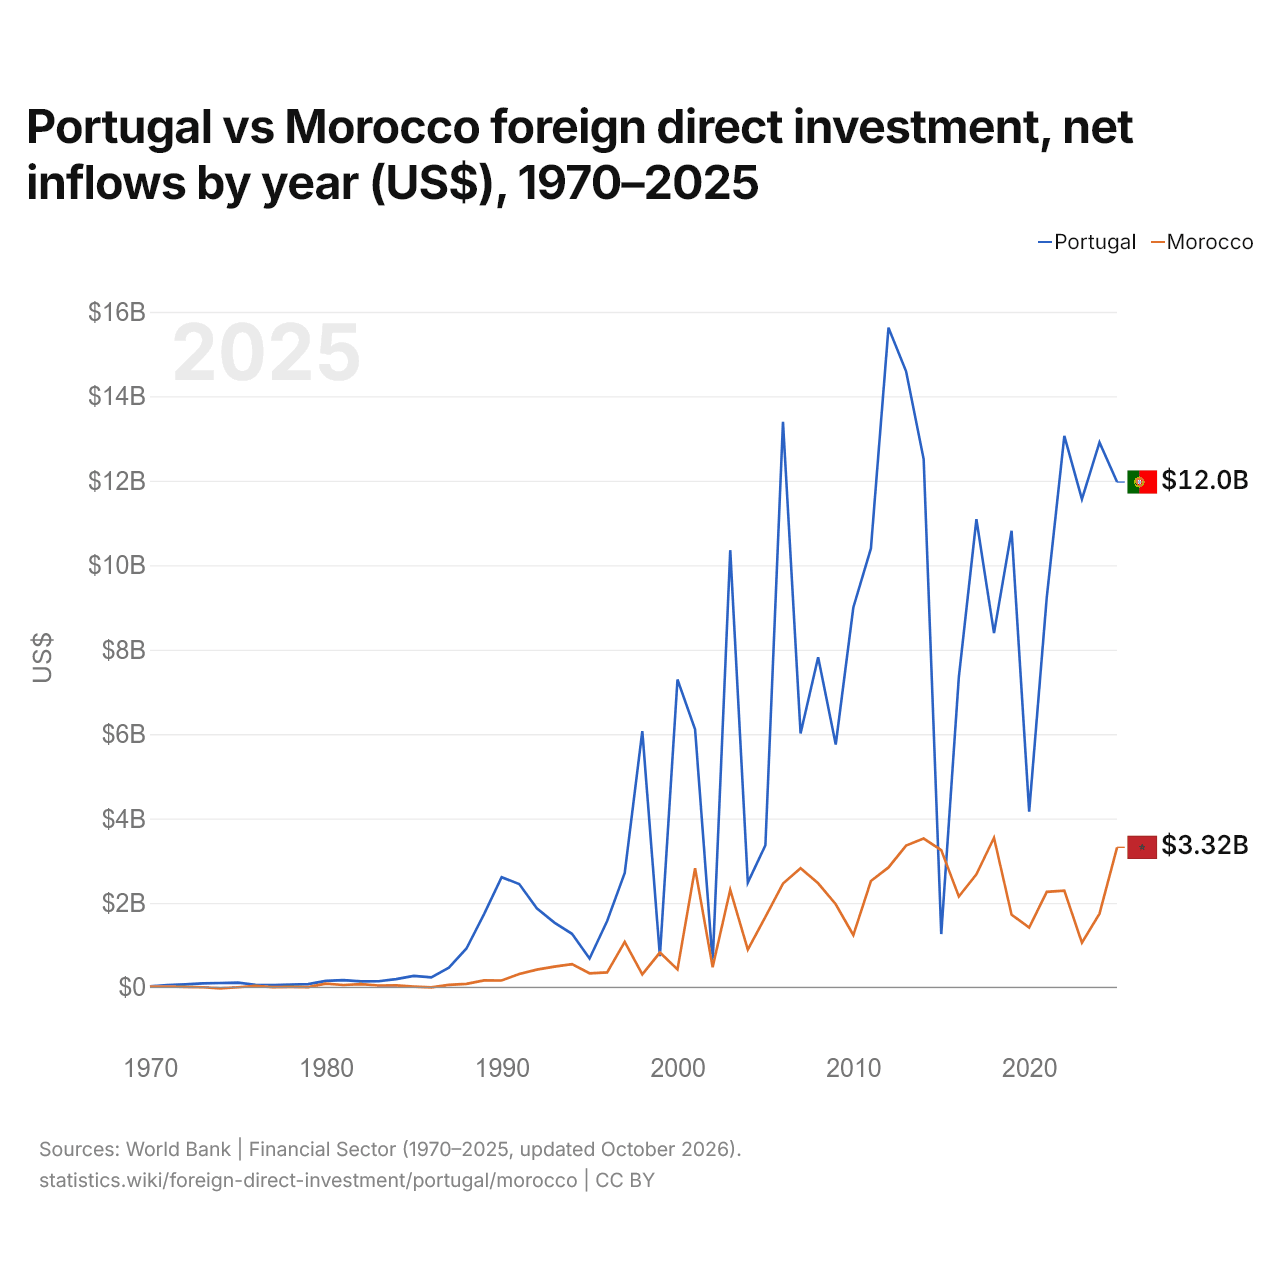
Portugal vs Maroc : investissements directs étrangers, entrées nettes par année ($ US), 1970–2025
| Année | $ US | |
|---|---|---|
 Portugal |
 Maroc |
|
| 2025 | 11 968 828 949 $ US | 3 318 381 812 $ US |
| 2024 | 12 908 896 806 $ US | 1 748 257 754 $ US |
| 2023 | 11 565 129 636 $ US | 1 060 023 610 $ US |
| 2022 | 13 059 930 356 $ US | 2 294 356 059 $ US |
| 2021 | 9 239 418 034 $ US | 2 264 148 625 $ US |
| 2020 | 4 165 618 741 $ US | 1 418 713 119 $ US |
| 2019 | 10 814 567 641 $ US | 1 720 825 003 $ US |
| 2018 | 8 390 559 335 $ US | 3 544 387 229 $ US |
| 2017 | 11 088 239 862 $ US | 2 680 109 856 $ US |
| 2016 | 7 350 311 647 $ US | 2 153 363 905 $ US |
| 2015 | 1 264 336 593 $ US | 3 252 913 902 $ US |
| 2014 | 12 512 849 287 $ US | 3 525 384 612 $ US |
| 2013 | 14 590 189 382 $ US | 3 360 909 924 $ US |
| 2012 | 15 623 883 335 $ US | 2 841 954 371 $ US |
| 2011 | 10 397 474 492 $ US | 2 521 362 081 $ US |
| 2010 | 8 998 318 742 $ US | 1 240 625 859 $ US |
| 2009 | 5 752 968 835 $ US | 1 970 323 920 $ US |
| 2008 | 7 820 637 676 $ US | 2 466 288 357 $ US |
| 2007 | 6 014 642 427 $ US | 2 825 801 376 $ US |
| 2006 | 13 394 502 768 $ US | 2 460 787 164 $ US |
| 2005 | 3 367 937 007 $ US | 1 670 609 689 $ US |
| 2004 | 2 485 161 769 $ US | 893 325 393 $ US |
| 2003 | 10 354 679 114 $ US | 2 312 829 823 $ US |
| 2002 | 587 893 730 $ US | 480 355 698 $ US |
| 2001 | 6 113 785 654 $ US | 2 824 557 252 $ US |
| 2000 | 7 292 581 671 $ US | 426 553 284 $ US |
| 1999 | 740 701 804 $ US | 826 974 027 $ US |
| 1998 | 6 071 328 303 $ US | 308 712 164 $ US |
| 1997 | 2 710 655 380 $ US | 1 079 341 332 $ US |
| 1996 | 1 571 447 865 $ US | 357 393 802 $ US |
| 1995 | 684 572 214 $ US | 334 768 273 $ US |
| 1994 | 1 269 714 976 $ US | 550 924 374 $ US |
| 1993 | 1 533 880 551 $ US | 491 466 065 $ US |
| 1992 | 1 873 428 553 $ US | 422 470 462 $ US |
| 1991 | 2 448 454 131 $ US | 317 462 141 $ US |
| 1990 | 2 609 986 421 $ US | 165 122 978 $ US |
| 1989 | 1 736 891 397 $ US | 167 056 032 $ US |
| 1988 | 921 583 433 $ US | 84 661 628 $ US |
| 1987 | 465 868 833 $ US | 59 574 901 $ US |
| 1986 | 238 151 216 $ US | 549 182 $ US |
| 1985 | 274 036 105 $ US | 19 975 167 $ US |
| 1984 | 198 221 489 $ US | 46 989 197 $ US |
| 1983 | 146 837 897 $ US | 46 123 624 $ US |
| 1982 | 144 033 052 $ US | 79 528 177 $ US |
| 1981 | 174 486 586 $ US | 58 581 336 $ US |
| 1980 | 156 950 738 $ US | 89 416 223 $ US |
| 1979 | 78 304 051 $ US | 7 437 549 $ US |
| 1978 | 65 993 577 $ US | 11 759 988 $ US |
| 1977 | 57 914 758 $ US | 7 994 056 $ US |
| 1976 | 62 999 101 $ US | 38 014 963 $ US |
| 1975 | 115 351 291 $ US | 5 020 000 $ US |
| 1974 | 106 000 000 $ US | −20 400 000 $ US |
| 1973 | 95 000 000 $ US | 5 490 000 $ US |
| 1972 | 73 000 000 $ US | 13 000 000 $ US |
| 1971 | 56 000 000 $ US | 23 100 000 $ US |
| 1970 | 28 900 000 $ US | 20 000 000 $ US |
En 2025, les entrées nettes d'investissements directs étrangers étaient de 12 milliards de dollars au Portugal et de 3,32 milliards de dollars au Maroc : 3,6 fois plus au Portugal. En 1970, elles étaient de 28,9 millions de dollars au Portugal et de 20 millions de dollars au Maroc.
Les entrées nettes d'investissements directs étrangers au Portugal ont été supérieures à celles du Maroc pendant 54 des 56 années de 1970 à 2025, et inférieures pendant 2.
Portugal vs Maroc : dernières entrées et sorties d'investissements étrangers
|
Portugal
|
Maroc
|
|
|---|---|---|
| Entrées nettes | +12,0 Md $US | +3,32 Md $US |
| Entrées nettes, % du PIB | +3,5 % | +1,8 % |
| Sorties nettes | +8,91 Md $US | +812 M $US |
| Entrées nettes, total 2016–2025 | +101 Md $US | +22,2 Md $US |
| Rang mondial | 32/192 | 56/192 |
Comparer les investissements directs étrangers de 2 pays au choix
Sources :
- Banque mondiale | Secteur financier (1970–2025, mis à jour en octobre 2026)
Creative Commons Attribution (CC BY) : vous pouvez copier, partager, adapter et réutiliser ce contenu, y compris à des fins commerciales, à condition de citer statistics.wiki et d’indiquer les modifications apportées. Les sources citées ci-dessus peuvent avoir leurs propres conditions de licence.